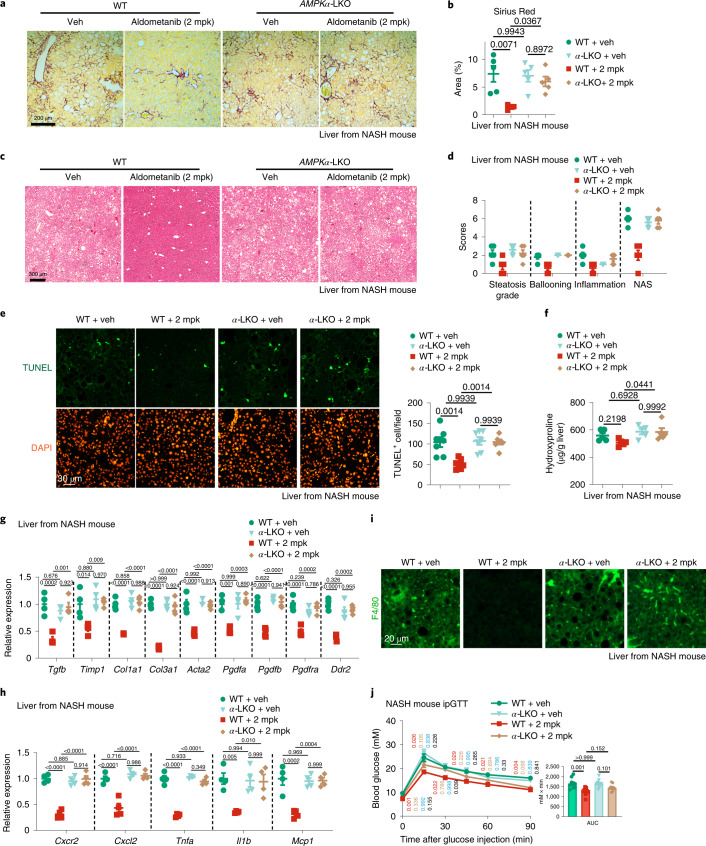
Fig. 7. Aldometanib alleviates NASH.
a,b,f,g, Aldometanib alleviated liver fibrosis in NASH mice. Mice were fed with AMLN diet for 30 weeks, and then twice-daily administration of 2 mpk aldometanib for a month. Hepatic AMPK was depleted by injecting tamoxifen 3 times a week for 1 week before the aldometanib treatment. Representative images of hepatic Sirius Red staining (a) and statistical analysis (b), hepatic levels of hydroxyproline (f) and the mRNA levels of fibrogenic genes (g) are shown. Data are the mean ± s.e.m.; n = 4 (g) or 5 (others) mice for each genotype/treatment; P values were determined by two-way ANOVA, followed by Tukey’s test. c,d, Aldometanib treatment decreased histological scores used to describe the features of NASH. Mice were treated as in a. Representative images from H&E staining of the liver (c), the NASs, ballooning scores, steatosis grades and the lobular inflammation scores (d; mean ± s.e.m. from n = 5 mice; P values were determined by two-way ANOVA, followed by Tukey’s test) are shown. e, Aldometanib reduces apoptosis rate of hepatic cells in NASH mice. Mice were treated as in a. Representative images from TUNEL/BrdU staining of the liver are shown, together with statistical analysis. Data are the mean ± s.e.m.; n = 7 mice for each genotype/treatment; P values were determined by two-way ANOVA, followed by Tukey’s test. h,i, Aldometanib inhibits inflammatory responses in the liver of NASH mice. Mice were treated as in a, and the mRNA levels of pro-inflammatory genes (h) are shown as the mean ± s.e.m. (n = 4 mice for each genotype/treatment). P values were determined by two-way ANOVA, followed by Tukey’s test. Representative images from F4/80 staining of the liver are shown (i). j, Aldometanib improved glucose tolerance of NASH mice. Mice were treated as in a, and results of ipGTT are shown as the mean ± s.e.m. (n = 9 mice for each genotype/treatment). P values were determined by two-way RM (glucose) or two-way (AUC) ANOVA, followed by Tukey’s test. Experiments were performed three times.

