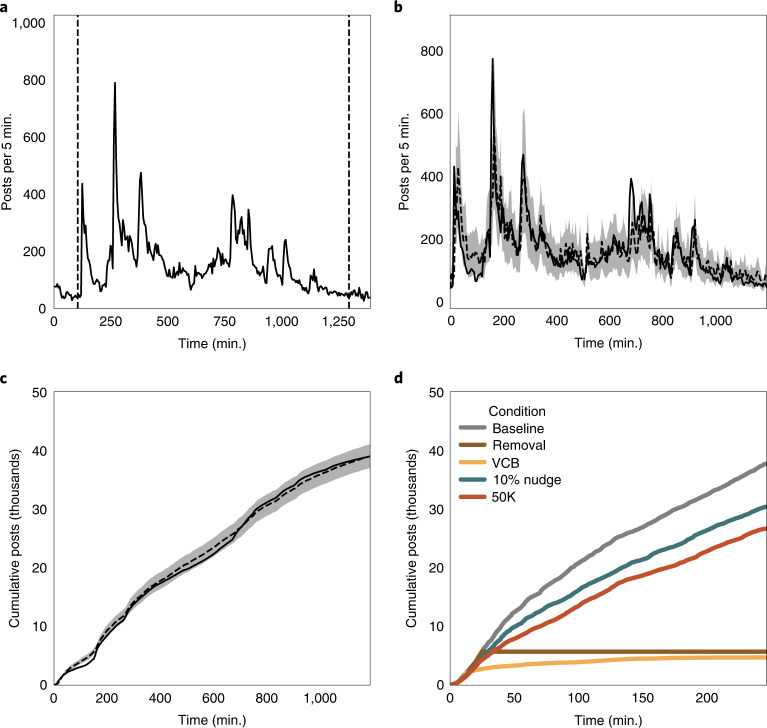
Fig. 1. Overview of our data-processing and generative model of viral misinformation spread.
a, Example of an event segmented from a larger incident (dashed lines). b, Our model fit to the time series for a single event. The dashed line indicates the expected value; the shaded region denotes the 89% CI. c, Cumulative engagement as a measure of total misinformation. The lines and shading are as in b. d, Model-simulated platform interventions for a single event. The lines indicate median cumulative engagement over 100 simulations. Grey indicates the baseline, blue indicates a 10% ‘nudge’, orange indicates banning, yellow indicates a virality circuit breaker and brown indicates the outright removal of content.

