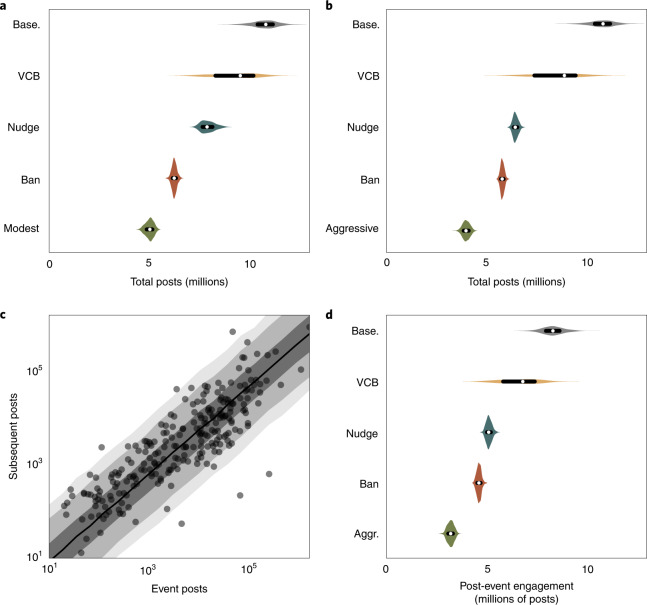
Fig. 4. Simulated impact of combining interventions.
a, The impact of a modest combined approach to intervention (described in the text, green) and each intervention applied individually. b, The impact of a more aggressive combined approach (described in the text, green) and each intervention applied individually. c, Relationship between engagement within the largest viral event for a given incident and subsequent engagement. d, Expected post-event engagement given the action taken during an event. The dots and lines within the violins indicate the median and interquartile range.

