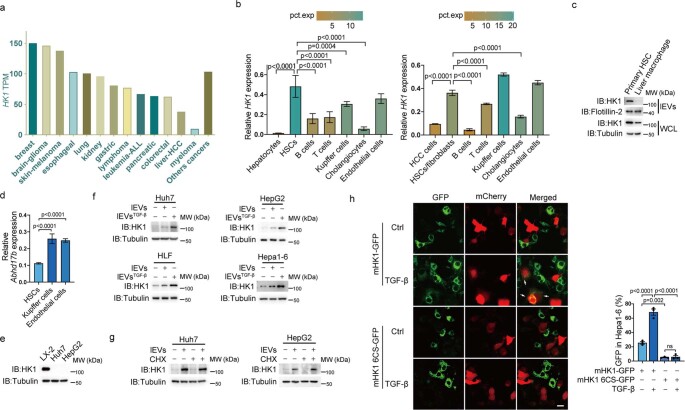
Extended Data Fig. 3. HCC cells hijack lEV HK1 derived from HSCs.
(a) HK1 expression levels in different types of cancer cell lines from the Cancer Cell Line Encyclopedia (CCLE) collection. (b) HK1 expression levels were analyzed using scRNA-seq data from normal liver tissues (GSE158723, cell numbers: 9823 hepatocytes, 124 HSCs, 184 B cells, 186 T cells, 1405 Kupffer cells, 515 cholangiocytes and 472 endothelial cells) and HCC tissues (GSE151530, cell numbers: 20640 HCC cells, 1820 HSCs, 1167 B cells, 21131 T cells, 5983 Kupffer cells, 2659 cholangiocytes and 3321 endothelial cells). (c) lEV HK1 was detected in primary HSCs and primary macrophages from CCl4-induced liver fibrosis mice. (d) Abhd17b expression levels in HSCs, Kupffer cells and endothelial cells were analyzed using scRNA-seq data (GSE171904, cell numbers: 6472 HSCs, 465 Kupffer cells, 3439 endothelial cells). (e) The HK1 protein was undetectable in Huh7 or HepG2 cells. (f) Huh7, HepG2 and HLF cells were treated with lEVs derived from LX-2 cells. Hepa1-6 cells was treated with lEVs derived from mo HSCs. (g) Effect of CHX on HK1 transmission into Huh7 and HepG2 cells. Cells were incubated with CHX (100 µg/mL) and lEVs extracted from TGF-β-treated LX-2 cells for 12 hours. (h) Comparison of HK1-GFP and HK1 6CS-GFP uptake by Hepa1-6 cells (indicated by arrows). HK1-GFP- or HK1 6CS-GFP-expressing mo HSCs cultured together with mCherry-expressing Hepa1-6 cells for 48 hours with or without TGF-β treatment. Scale bar, 10 μm, n = 3 independent experiments. Tubulin was used as a protein loading control. Statistic data are presented as the mean ± SEM. Statistical analyses were determined by one-way ANOVA, followed by Tukey’s post hoc test (b, d, h). All western blots are repeated three times and one of them is shown.

