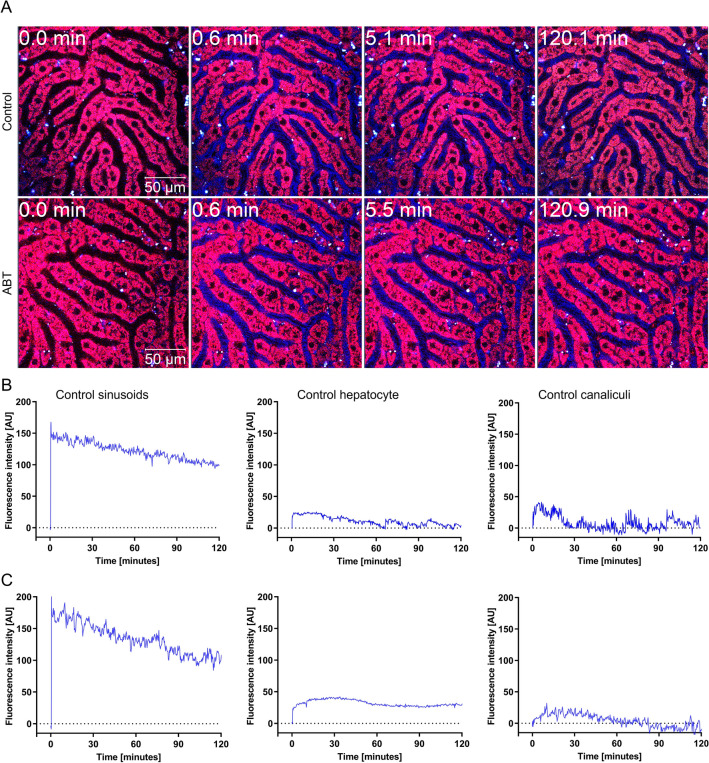
Fig. 7.
Treatment with ABT has no major influence on the transport of OTA from the sinusoidal blood into hepatocytes and secretion into the bile canaliculi. A Intravital imaging of OTA (7.5 mg/kg intravenous) transport in livers of mice pre-treated (2 h) with ABT (150 mg/kg, gavage) or vehicle. The time in the upper left gives the minutes after injection of OTA. OTA is visualized by its blue auto-fluorescence; the morphology of hepatocytes is visualized by the red dye TMRE. B and C Quantification of OTA-associated fluorescence in blood sinusoids, hepatocytes and in bile canaliculi in controls (vehicle) and in ABT pre-treated mice. The corresponding time-lapse videos are available in the supplement. Three mice were imaged per group

