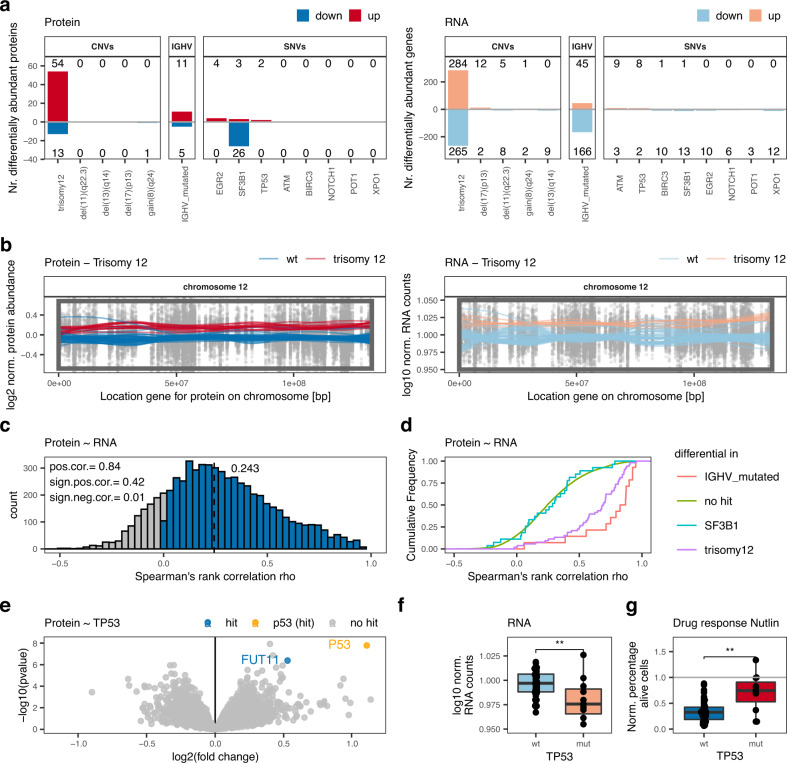
Fig. 2. Interplay between genetic alterations, proteomics, and transcriptomics.
a Number of significantly differentially abundant proteins (left; FDR < 0.1%; |log2FC| > 0.5) and differentially expressed genes (right; FDR < 0.1%; |log2FC| > 1.5) in relation to recurrent genetic alterations. b Levels of both proteins and transcripts from chromosome 12 and the impact of trisomy 12. Normalized protein abundance (left panel) and gene expression levels (right panel) for chromosome 12 are shown. Points represent individual values for protein/gene–patient pairs. Lines are locally weighted scatterplot smoothed values for individual patients with (red) or without (blue) trisomy 12. The box is the region affected by trisomy 12. c Distribution of Spearman’s rank correlations for protein-mRNA pairs. d Cumulative density distribution of protein-mRNA Spearman’s rank correlations for the proteins significantly differentially abundant in IGHV mutated (red), trisomy 12 (pink) or SF3B1-mutated (blue) CLL in comparison to all other proteins without these associations (green). e Volcano plot indicating differential proteins in TP53 mutated in comparison to TP53 wild-type CLL; hit = adjusted p < 0.001, |log2FC|>0.5. P values calculated by limma. Multiple testing correction by FDR to identify hits. f TP53 transcript levels in TP53 mutated (mut, n = 11) and wild-type (wt, n = 47) biologically independent CLL samples; two-sided Wilcoxon signed-rank test p = 0.005. g Percentages, normalized to solvent control, of alive cells of TP53 mutated (mut, n = 56) and wild-type (wt, n = 11) biologically independent CLL samples treated ex-vivo with 9 µM nutlin 3a; two-sided Wilcoxon signed-rank test, p = 0.0019. Boxplots are represented as first and third quartiles with a median in the center. Whiskers are defined as 1.5 times the interquartile range (f and g). Source data are provided as a Source Data file.

