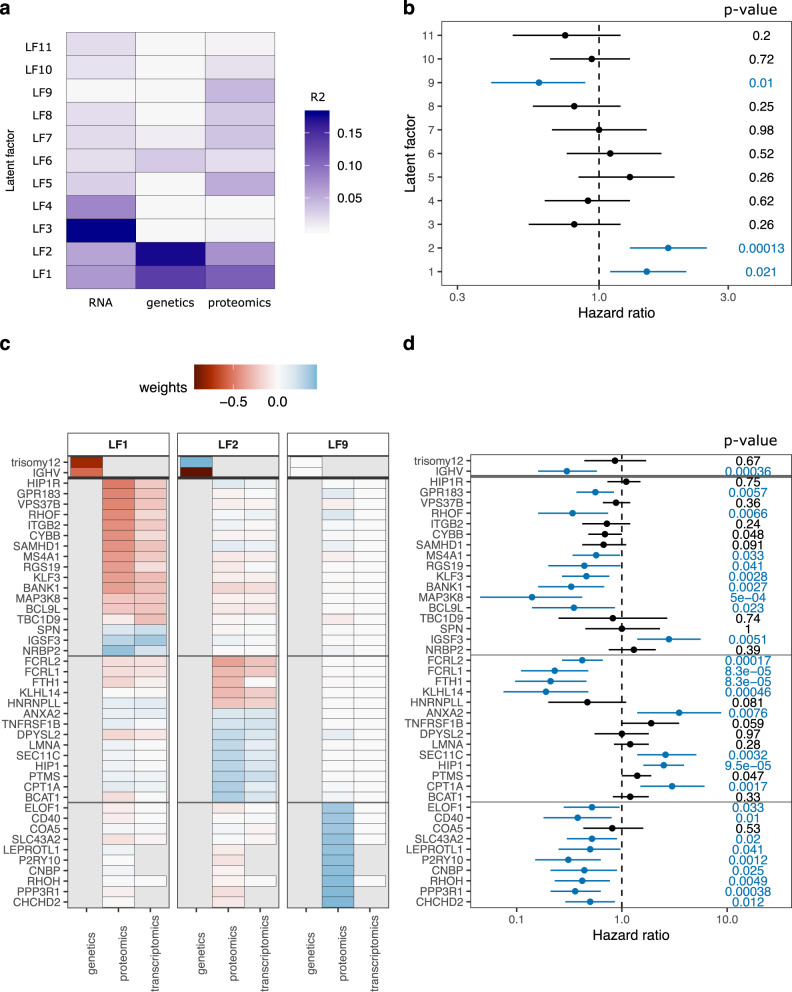
Fig. 3. Multi-omics factor analysis (MOFA) of proteogenomics dataset.
a MOFA of proteome, transcriptome, and genome dataset identified 11 latent factors (LF) each explaining at least 1.5% of variance. Explained variances per factor and dataset are color-coded. b Hazard ratios from Cox regression of LFs with time to next treatment (TTNT). LF1, LF2, and LF9 were significantly (FDR < 10%, blue) associated with TTNT. P values (Wald-test) are shown on the right. Mean and 95% confidence intervals are shown. n = 61 biologically independent patient samples. c Genes, transcripts, and proteins with the strongest weights loaded onto LF1, LF2, and LF9. Weights were scaled between genetics (divided by two), proteomics, and transcriptomics (times ten) to achieve similar ranges. d Hazard ratios from Cox regression for TTNT with genes and proteins with strong weights for LF1, LF2, and LF9. Significant associations (p < 0.05) are colored in blue. P values (Wald-test) are shown on the right. Mean and 95% confidence intervals are shown. n = 72 biologically independent patient samples. Source data are provided as a Source Data file.

