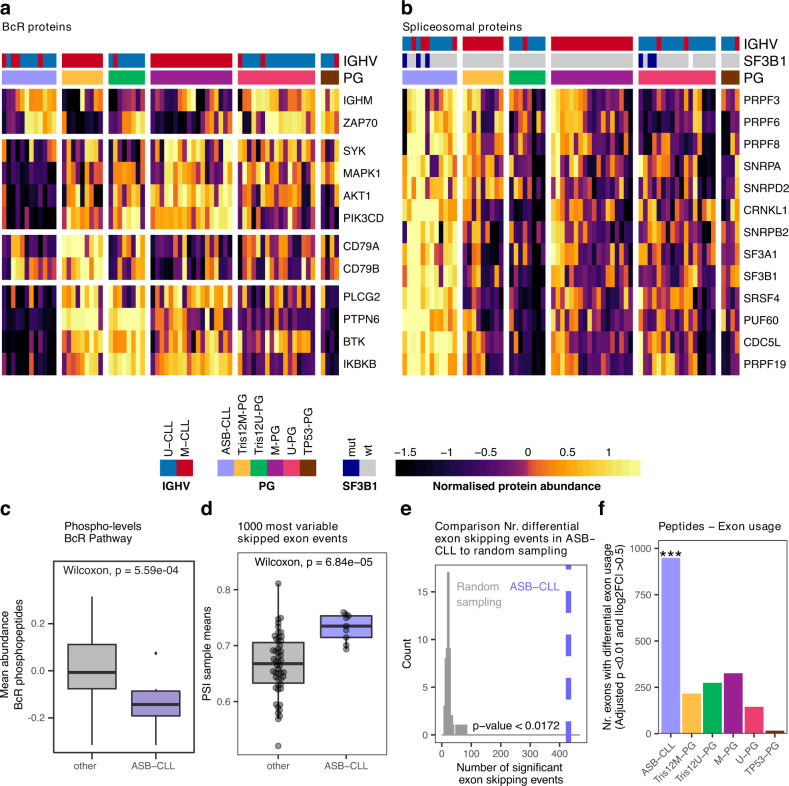
Fig. 5. Characterization of the new proteomics group ASB-CLL.
a Heatmaps of scaled log2 protein abundances for selected BcR proteins and b spliceosome components. Patients were grouped according to PG and the proteins were clustered hierarchically. Based on these profiles the group “New-PG” was renamed to “ASB-CLL” (Altered Spliceosome, low BcR signaling proteins CLL) c The mean relative intensity of phosphorylated peptides uniquely mapping to proteins whose corresponding genes belong to the gene set: KEGG_B_CELL_RECEPTOR_SIGNALING and which could be quantified in at least 50% of TMT-channels were calculated per sample. 12 biologically independent ASB-CLL patient samples were compared to 56 other biologically independent patient samples. d Mean percent spliced-in (PSI) value per patient calculated from the 1000 most variable exon skipping events across all patients of the discovery cohort. 9 biologically independent ASB-CLL patient samples were compared to 50 other biologically independent patient samples. Boxplots are represented as first and third quartiles with a median in the center. Whiskers are defined as 1.5 times the interquartile range (c and d). e Number of significant differential exon skipping events between ASB-CLL and all other groups for the actual PG assignment (blue line) and random PG permutations (gray distribution). f Peptide-based differential exon usage per PG (FDR 1%, |logFC| > 0.5). One-sided fisher exact test corrected for multiple testing using the FDR method was used to assess differences between the groups (each group vs all others). For ASB-CLL the adjusted p value = 1.89E−239. Source data are provided as a Source Data file.

