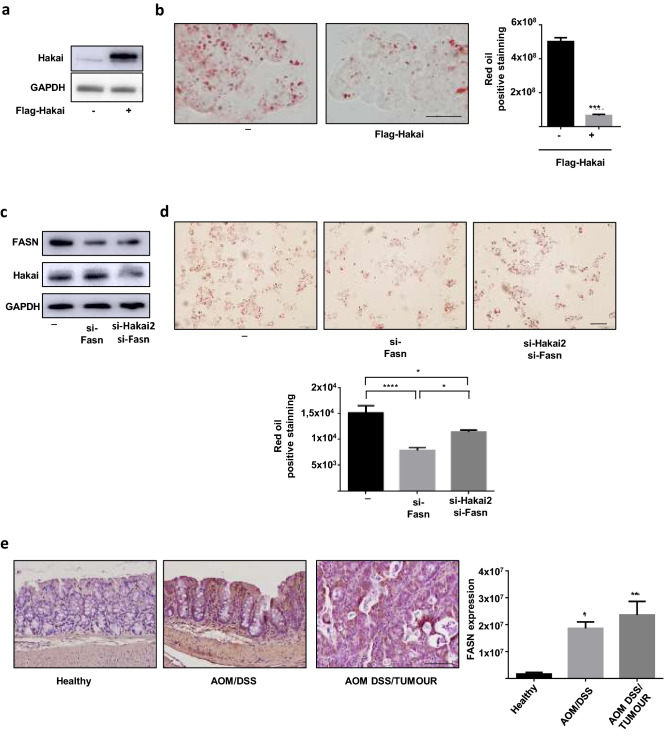
Figure 5.
Hakai controls lipid accumulation via FASN. (a) Hakai expression in HCT116 cells transfected with Flag-Hakai was analyzed by Western blot analysis and (b) the effect on lipid accumulation by staining with Oil Red is shown together with quantification of cell staining (right panel). Scale bar 125 μm. (c) HCT116 cells transfected with siRNA-Hakai2 or siRNA control in presence of absence of siRNA-FASN, analyzed by Western blot analysis and (d) staining with Oil Red together with quantification of cell staining results is. (b and d) Five pictures of each sample were taken and quantified. Values are means ± SD of staining intensity signal scoring per area. Quantification and calibration of the images were performed with Image Analysis Toolbox software for Image J. Kruskal–Wallis with Tukey correction test analyses show statistical differences between overexpression/silencing of Hakai or FASN and controls (*p < 0.05; **p < 0,01; ***p < 0,001; ****P < 0.0001). Scale bar 50 μm. (e) Immunohistochemistry staining (letf panel) and quantification (right panel) of FASN in mouse samples of the AOM/DSS Colitis-associated colorectal cancer model (inflamed epithelium and tumours, healthy mice, n = 7; AOM/DSS-treated mice, n = 14). Immunohistochemistry staining and quantification were performed as indicated in figure legend 1. Scale bar 125 μm. The blots images were cropped prior hybridization and original blots are included in Supplementary Information.

