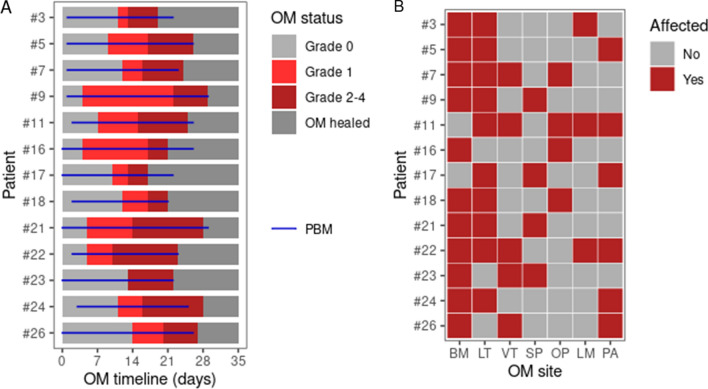
Figure 1.
Oral mucositis (OM) timeline and sites affected by OM for each patient. (A) OM timeline in days for each OM patient. The OM grade along the timeline is indicated by a color scheme and the use of photobiomodulation (PBM) is indicated by a blue horizontal line. (B) Heatmap with the oral sites affected by OM for each patient. BM buccal mucosa, LT lateral tongue, VT ventral tongue, SP soft palate. OP oropharynx, LM labial mucosa, PA palatoglossal arches.

