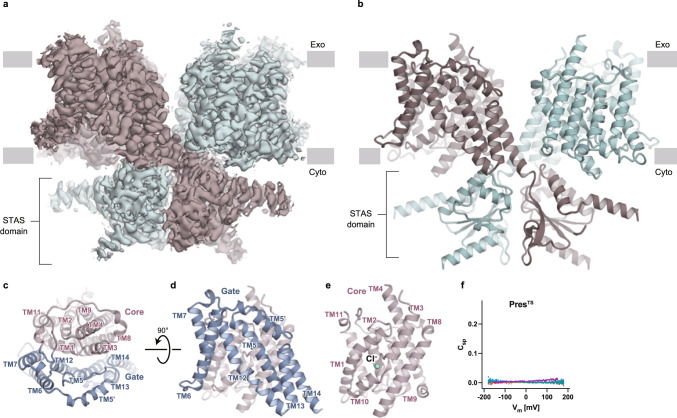
Fig. 1. Cryo-EM structure of PresTS.
a A Cryo-EM map of the PresTS homodimer. Each protomer is shown in a different color (green and dark brown). Gray boxes indicate the location of the lipid bilayer, with the extracellular (Exo) and cytosolic (Cyto) sides shown. b Ribbon representation of the PresTS homodimer, with protomers shown in the same colors used in panel a. c Transmembrane domain of a PresTS protomer, viewed from the extracellular side. The core (pink) and gate (blue) domains are shown as ribbon models. “TM” indicates transmembrane helix. See Supplementary Fig. 2a for the detailed TM numbering information. d, e Side views of the gate (d) and core (e) domains. The green sphere indicates a bound Cl− ion. f Voltage-dependent cell membrane electric capacitance measured in HEK293T cells expressing PresTS. NLC was undetectable in cells expressing PresTS, although it targets the cell membrane (Supplementary Fig. 8). Source data are provided as a Source Data file.

