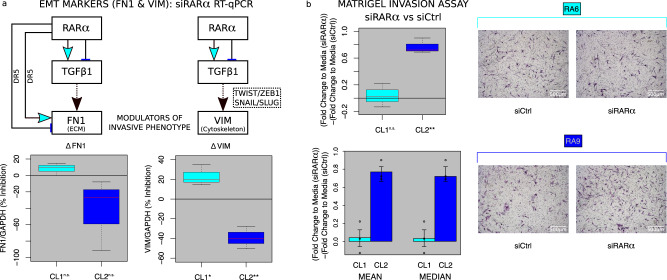
Fig. 5. RARα regulates TGFβ signaling and Epithelial-to-Mesenchymal Transition (EMT) effectors in a cluster-specific fashion with subsequent transcriptional and functional validation.
a siRARα RT-qPCR on CL1 and CL2 RA FLS. Arrows (↑) illustrate activating and blunt ended lines (T) inhibiting/repressive effects. Cyan infill depicts the primary CL1 regulation logic, dark blue representing the primary CL2 regulation logic and black arrows representing both CL1 and CL2 logic. Boxplots of change in mRNA levels under siRARα depletion for the EMT markers FN1 and VIM (CL1: p = 0.0189, CL2: p = 0.0041) (transcriptionally regulated downstream of TGFβ1). CL1 n = 3 and CL2 n = 3 biologically independent cell lines. p-values calculated by paired two-tailed Student’s t-test for siRARA vs CTL *p < 0.05 **p < 0.001. b TGFβ-stimulated Matrigel Invasion Assay boxplot for CL1 and CL2 (p = 0.0077) and barplot of mean and median values (error bars represent 1 standard deviation). p-values calculated by paired two-tailed Student’s t-test for siRARA vs CTL **p < 0.001. CL1 n = 3 and CL2 n = 3 biologically independent cell lines. Representative 4× magnification images of migrated RA FLS in siRARα and siCtrl for two exemplar patient cell lines RA6 (CL1) and RA9 (CL2). For all box plots, red center line for median, whiskers represent maximum and minimum values, box width from quartile 1 to quartile 3. Source data are provided as a Source Data file.

