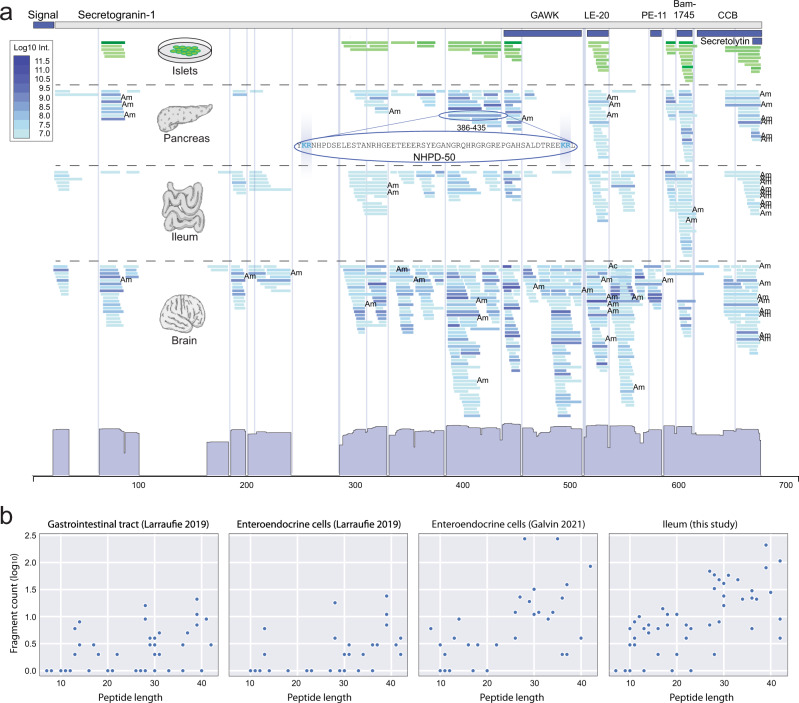
Fig. 3. Sensitivity and degradation in peptidomics data.
a The secretogranin-1 protein (Uniprot ID: P16014) shown in grey and previously identified peptides (GAWK, LE-20, PE-11, Bam-1745, CCB) as dark blue boxes. The abundance of the peptides are colour coded green for islets and blue for tissue samples. Abundance histogram shown at the bottom and dibasic motifs depicted by vertical lines. Ac Acetylation, Am Amidation. b Degradation characteristics shown as a dot plot for the set of known annotated peptides (Supplementary Data 3) as a function of peptide length (x-axis). The y-axis shows the number of overlapping smaller peptides for the known set (log10 count). Detection of degradation products of known annotated peptides was observed across all studies irrespective of different peptide enrichment methodology applied, illustrates the general needle-in-a-haystack problem of identifying the correct candidate peptide sequence for testing among overlapping fragments. Source data are provided as a Source Data file.

