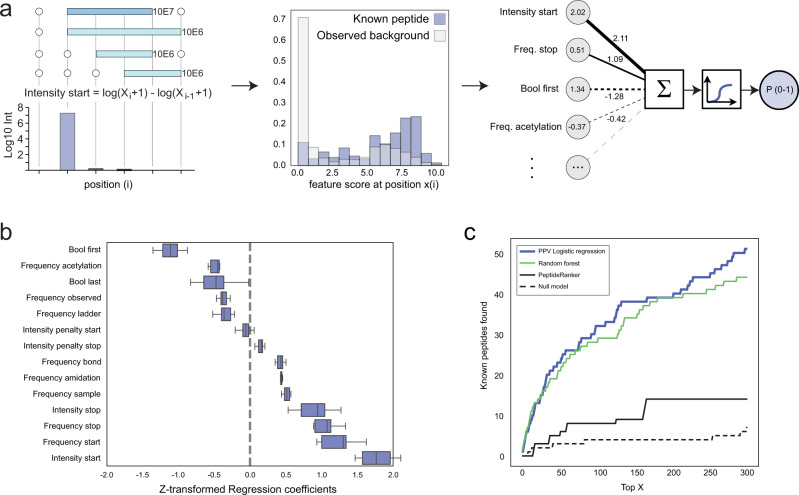
Fig. 4. Computational identification of potential bioactive peptides.
a Illustration of feature encoding and distribution (using the feature “Intensity start” as example) and PPV model design (Supplementary Note 1). In the feature distribution plot, the group of known annotated peptides is shown as blue bars, all other observed peptides as white bars and the overlap between the two in light blue. b Box plot showing the model regression coefficients (weights) in the final model. Each box-plot shows the coefficients across the 20 models from 5-fold nested cross-validation. The box plot centre line is the median, the bounds are the lower (25th percentile) and upper (75th percentile) quartile values. The lower whisker extends to the lowest observed value greater than the lower quartile minus 5 times the interquartile range (IQR) of the data, the upper whisker to the highest observed value lower than the upper quartile plus 5 times the IQR. c Number of known annotated peptides found by each type of model as a function of rank based scoring, using nested cross-validation. PPV model based on Logistic Regression (solid blue), Random forest (green), PeptideRanker (solid black), Null model (dotted black); model uses only a single input feature, the log10 (total peptide abundance). See Supplementary Fig. 7 and Supplementary Note 1 for description of the different models, features and model development. Source data are provided as a Source Data file.

