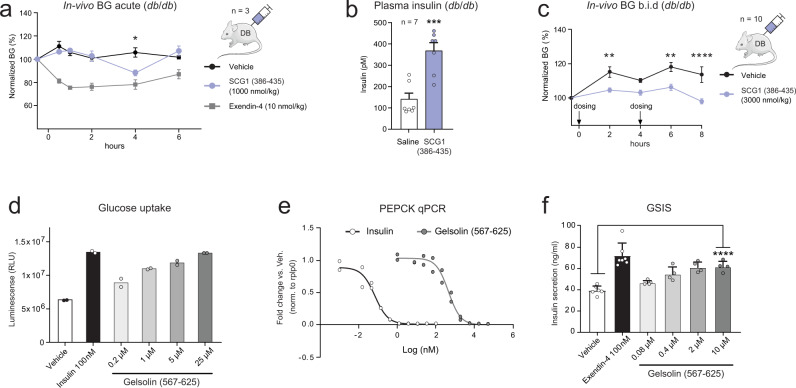
Fig. 8. In-vitro and in-vivo assays reveals potential bioactive peptides.
a BG mean values ± SEM in n = 3 db/db mice after SCG1 peptide (NHPD-50, position 386–435) intraperitoneal injection at 1000 nmol/kg. Exendin-4 at 10 nmol/kg. Baseline normalized to 100%. Two-way ANOVA with post-hoc Dunnett’s test, P = 0.022 (4 h). b Plasma insulin (pmol/L) mean values ± SEM in n = 7 db/db mice 6 h after SCG1 peptide (NHPD-50) dosing at 2658 nmol/kg. Unpaired two-sided t-test, P = 0.0003. c BG mean values ± SEM in n = 10 db/db mice by twice daily SCG1 peptide (386–435) dosing at 3000 nmol/kg. 8 h of day 1 are shown. Two-way ANOVA, Sidak’s Multiple comparisons test, P = 0.0055 (2 h), P = 0.0013 (6 h), P < 0.0001 (8 h). d Glucose uptake in 3T3-MBX cells at day 19. N = 20,000 cells/well in two independent biological experiments. Cells were treated overnight with diluted Gelsolin peptide (567–625) or with 100 nM Insulin. e Pck1 qPCR in primary rat hepatocytes. N = 30,000 cells/well in two independent biological replica experiments. Cells treated for 4 h with serial diluted Gelsolin peptide (567–625) or serial diluted Insulin. Pck1 expression was normalized to Rplp0. f Glucose-stimulated insulin secretion (GSIS) calculated as ng/mL ± SD in INS-1E luciferase cells (50,000 cells/well). The cells were incubated with Gelsolin peptide (567–625) or Exendin-4 at 100 nM for 30 min. Vehicle and Exendin-4 controls are n = 6 independent measurements, whereas Gelsolin treated cells are n = 4 independent measurements. Unpaired two-sided t-test, P < 0.0001. Source data are provided as a Source Data file.

