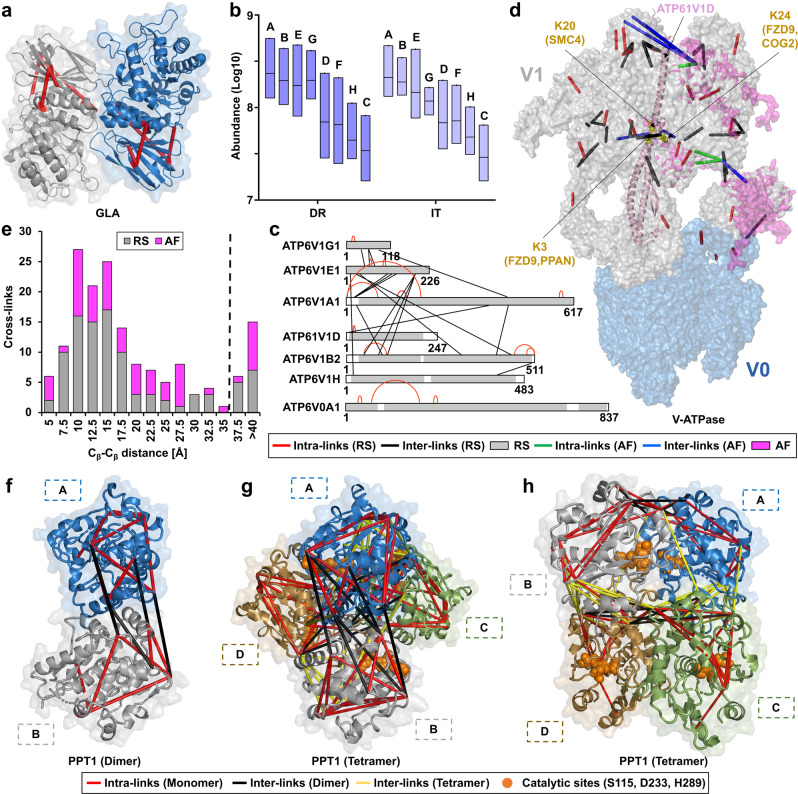
Fig. 3. Cross-link-based structural refinement of the V-ATPase and PPT1 complex.
a Matching of cross-links to the crystal structure of lysosomal alpha-galactosidase A (GLA). b Average iBAQ abundances for individual V-ATPase subunits based on the analysis of lysosome-enriched fractions in a non-cross-linked state. Each box depicts the interquartile range (IQR, the range between the 25th and 75th percentile, median = line). c Cross-links identified for individual V-ATPase subunits. Structurally resolved regions are colored gray, and unresolved regions are white. d Refined structure of the V-ATPase complex. Identified cross-links were integrated into the V-ATPase cryo-EM structure7. Missing regions were supplemented with predicted structures from AlphaFold2 based on the identified cross-links. e Distances for mapped cross-links to crystal structures and AlphaFold2 models for lysosomal proteins, bin size: 2.5 Å. f Reported homodimeric human PPT1 structure (PDB identifier 3GRO). g, h Tetrameric PPT1 model representing the most favorable energetic state and fulfilling DSSO’s distance constraints for all 18 cross-links. A, B, C, and D indicate individual subunits. DR disrupted, IT intact, RS resolved structure, AF AlphaFold2. Source data are provided as a Source Data file.

