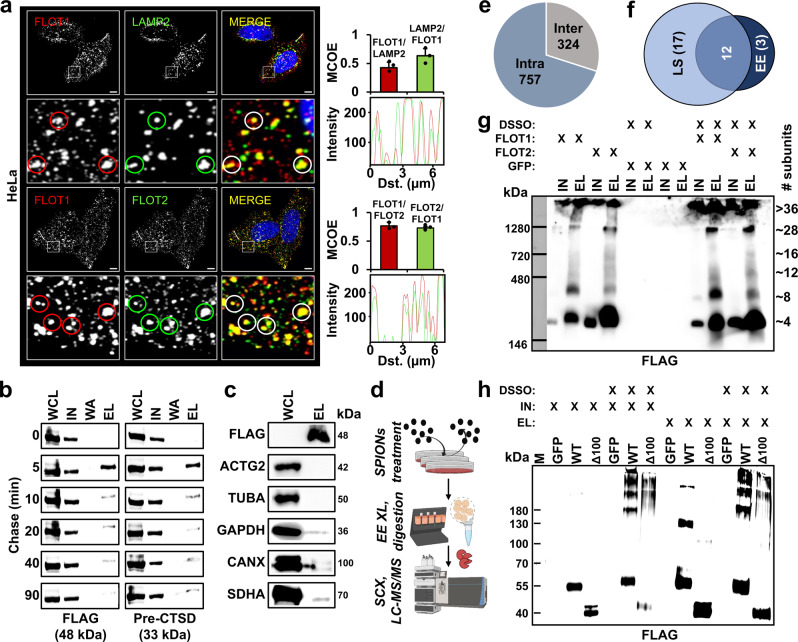
Fig. 5. Investigation of higher-order flotillin assemblies in lysosome- and early endosome-enriched fractions.
a HeLa cells were stained with antibodies for FLOT1, FLOT2, and LAMP2 followed by microscopy imaging (n = 3). Lower panels display a zoom-in of the regions indicated in the full picture. Mander’s coefficients show the average degree of overlap of one protein population relative to another. Data are presented as mean values + SD (n = 3, cells examined over one experiment). Profile plots indicate the degree of colocalization for individual vesicles. b Analysis of FLOT1/FLOT2 in early endosomes (n = 1). Following pulsed SPIONs treatment, endosomes were enriched at the indicated chase times. Pre-CTSD serves as a marker for early endosomes. c Western blot analysis of early endosome-enriched fractions with marker proteins for different subcellular compartments (n = 1): Cytosol (ACTG2 and GAPDH), cytoskeleton (TUBA), endoplasmic reticulum (CANX), and mitochondria (SDHA). d Experimental workflow for early endosome enrichment and XL-LC-MS/MS analysis. Created with BioRender.com. e Overview of the cross-linking dataset obtained from early endosome-enriched fractions. f Overlap of unique FLOT1/FLOT2 cross-links for XL-LC-MS/MS analyses of early endosome- and lysosome-enriched fractions. g Western blot analysis of BN-PAGE-separated FLAG-IP eluates with/without cross-linking by DSSO (n = 5). IN/EL refers to individual FLAG-IP fractions. h Western blot analysis of SDS-PAGE separated FLAG-IP ELs with/without DSSO cross-linking for WT and FLOT1/FLOT2 residue 200–300 deletion mutants (Δ100) (n = 3). Scale bar = 5 µM; WCL whole cell lysate, IN input, WA wash, EL eluate, MCOE Mander’s coefficient, Dst. distance, LS lysosomes, EE early endosomes, XL cross-linking, SPIONs superparamagnetic iron oxide nanoparticles, M marker, WT wild type. Source data are provided as a Source Data file.

