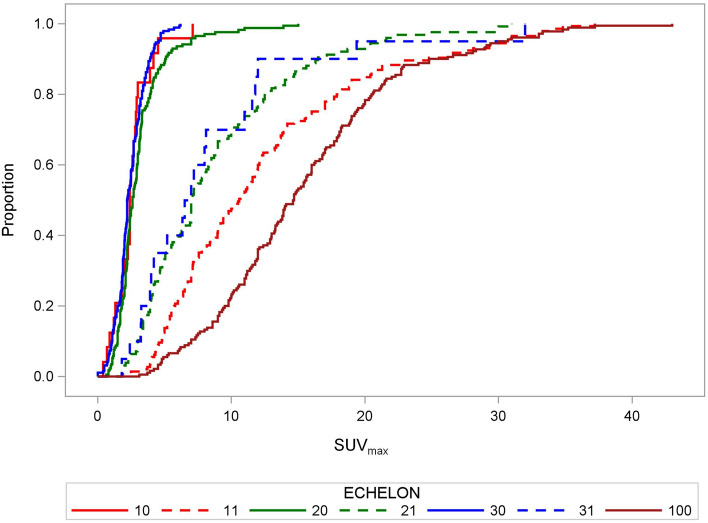
Figure 2.
Empirical distribution functions of SUVmax values in lymph nodes. Empirical distribution functions of SUVmax in lymph nodes at the different echelons of the mediastinum, plotted separately for EBUS-positive and negative echelons. Group (1.0): echelon-1, EBUS-negative; Group (1.1): echelon-1, EBUS-positive; Group (2.0): echelon-2, EBUS-negative; Group (2.1): echelon-2, EBUS-positive; Group (3.0): echelon-3, EBUS-negative; Group (3.1): echelon-3, EBUS-positive; Group (10.0): primary tumour. The SUVmax for the primary tumours or EBUS-TBNA involved LNs decreased significantly from the primary tumour to echelon-1 and echelon-2 lymph nodes (P < 0.01, Kruskal–Wallis test), while the distributions of echelon-2 and -3 nodes did not differ.

