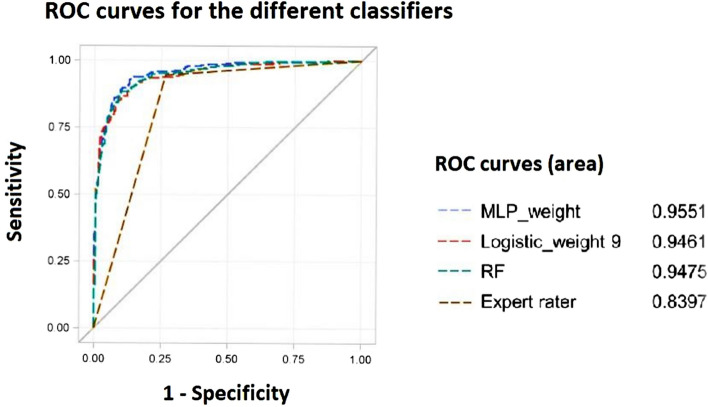
Figure 4.
ROC curves for the different classifiers. The figure shows the receiver operator characteristic (ROC) curves for comparing the performance of the cross-validated multilayer perceptron neural network (MLP), random forest (RF) and logistic regression models with the expert rater. The logistic regression model was trained with a weighting factor 9 and the MLP model with a weighting factor of 3.06 for false negatives to achieve the same sensitivity as the expert rater at a cut-off point for the estimated probability of EBUS-positivity of 0.5. In addition, the ROC curve for the MLP trained with a weighting factor of 10 for EBUS-positives is shown.

