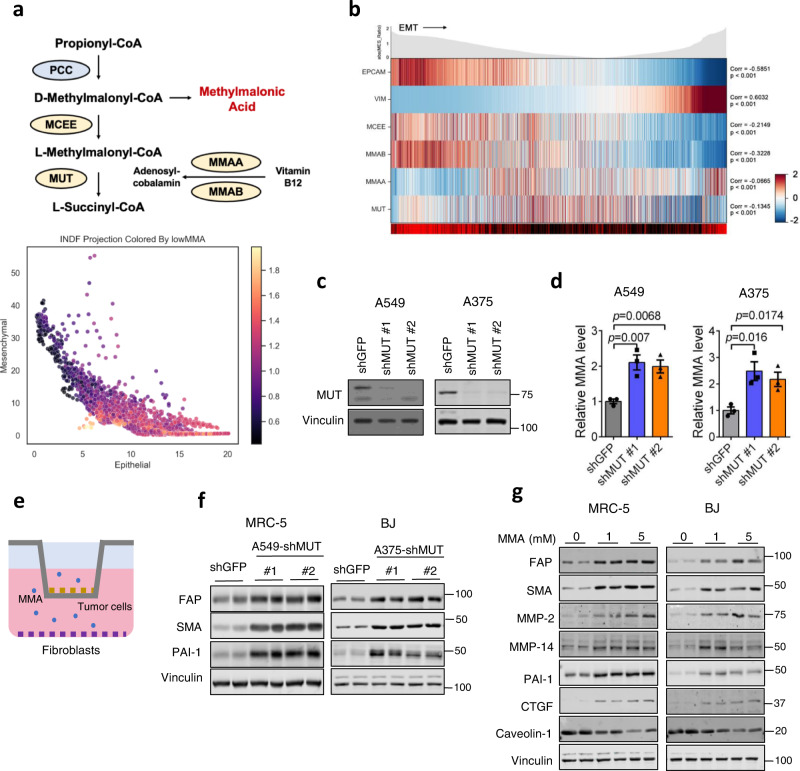
Fig. 1. MMA produced by tumor cells promotes a cancer-associated fibroblast phenotype.
a Patient-derived tumor cells (n = 2537) projected according to imputed Vimentin expression and imputed EPCAM expression. Each cell is colored by average imputed expression of negative regulators of MMA production (MMAA, MMAB, MCEE, and MUT), highlighted in yellow in the diagram depicting propionate metabolism pathway (above). b The z-normalized imputed expression of relevant mesenchymal, epithelial, and MMA marker genes is displayed on the heat map ranked by MES Ratio, defined as the log10 transform of the expression ratio of imputed VIM and EPCAM for each cell. The MES Ratio curve along the top of the heat map shows the absolute value of the MES Ratio across the ranked cells. The color bar along the bottom of the heat map shows the sample tissue source (metastasis: red and primary: black). The gene correlation and associated p values were computed by performing a two-sided spearman test between the normalized (non-imputed) expression of each gene and the MES Ratio. c MUT was knocked down in A549 and A375 tumor cells. Immunoblots show the protein level of MUT in cell lysates. d MMA levels in the conditioned medium of the tumor cells were measured, normalized to the total cell number (n = 3 independent experiments, mean ± SEM, two-sided paired t-test). e Schematic of the co-culture experiment performed in (f). Tumor cells with shGFP or shMUT knockdown were seeded in a transwell insert, and co-cultured with fibroblasts seeded on the bottom of six-well plates. Fibroblast lysates were collected for immunoblots. f Immunoblots measuring CAF markers in MRC-5 fibroblasts co-cultured for 4 days with shMUT-knocked down A549 tumor cells and BJ fibroblasts co-cultured for 4 days with shMUT-knocked down A375 tumor cells. g Immunoblots measuring CAF markers in MRC-5 and BJ cell lysates treated with 1 mM or 5 mM of MMA for 5 days.

