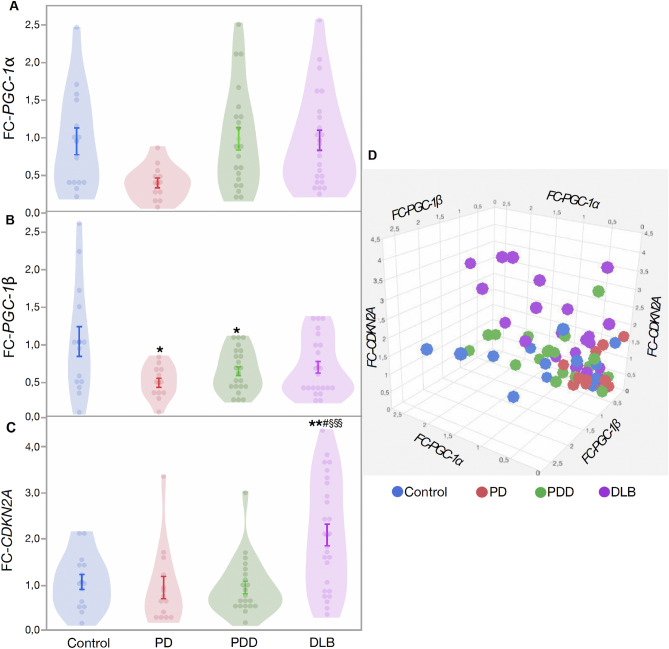
Figure 4.
Change in PGC-1α, PGC-1β and CDKN2A gene expression in brain tissues. (A) Fold change of PGC-1α in patients compared to controls, (B) fold change of PGC-1β in patients compared to controls, (C) fold change of CDKN2A in patients compared to controls, (D) 3D graph showing the relation between expression of PGC-1α, PGC-1β and CDKN2A in patients and controls. Data are presented as mean ± SE. Controls versus patients p < 0.05 = *, p < 0.005 = **, p < 0.0005 = ***; PD versus PDD/DLB, p < 0.05 = #, p < 0.005 = ##, p < 0.0005 = ###; PDD versus DLB, p < 0.05 = §, p < 0.005 = §§, p < 0.0005 = §§§.

