Figure 2.
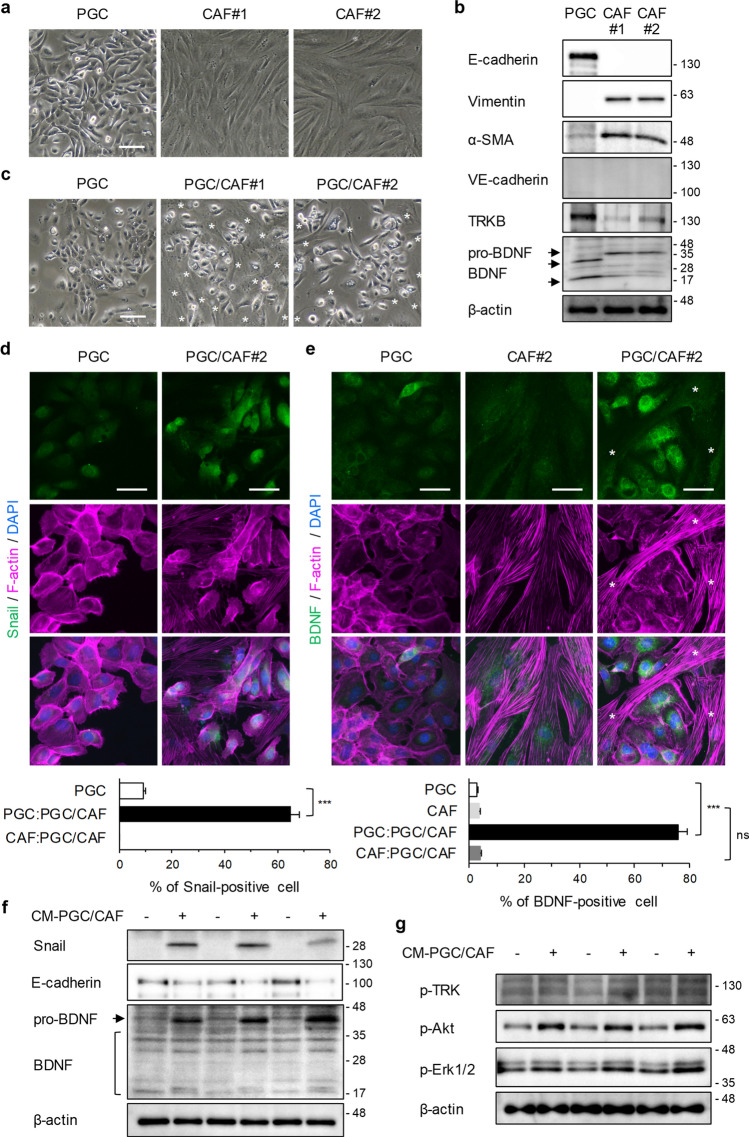
Promotion of EMT and upregulation of BDNF in PGC cells by co-culture with CAFs. (a) Representative phase-contrast images of isolated PGCs and CAFs. Scale bar, 200 μm. (b) Characterization of established PGC cells and CAFs by WB analysis using the indicated antibodies. (c–e) Representative images of phase contrast (c) and immunofluorescence staining for Snail (d) and BDNF (e) in PGC cells which were mono-cultured or co-cultured with CAFs for 4 days. Scale bars, 200 μm (c) and 50 μm (d,e). Asterisks indicate CAFs. PGC, single-cultured PGC cells; PGC/CAF, direct-co-cultured PGC cells and CAFs. Histograms depict the percentages of Snail- or BDNF-positive cells per field as the mean ± SEM. The percentages were calculated from more than 12 fields (at least 100 cells per field) of each group. PGC:PGC/CAF, direct-co-cultured PGC cells with CAFs; CAF:PGC/CAF, direct-co-cultured CAFs with PGC cells. ***P < 0.001; ns not significant (Student’s t-test). (f) Expression of Snail and BDNF in PGC cells was determined by WB analysis. PGC cells were cultured for 4 days with control cell-free conditioned medium (CM) from PGC cell cultures or CM from PGC/CAF co-cultures. (g) Phosphorylation levels of TRK and its down streams, Akt and Erk1/2 were examined by WB analysis. Briefly, PGC cells were serum-starved for 24 h and treated with CM from PGC/CAF co-cultures for 10 min.

