Figure 5.
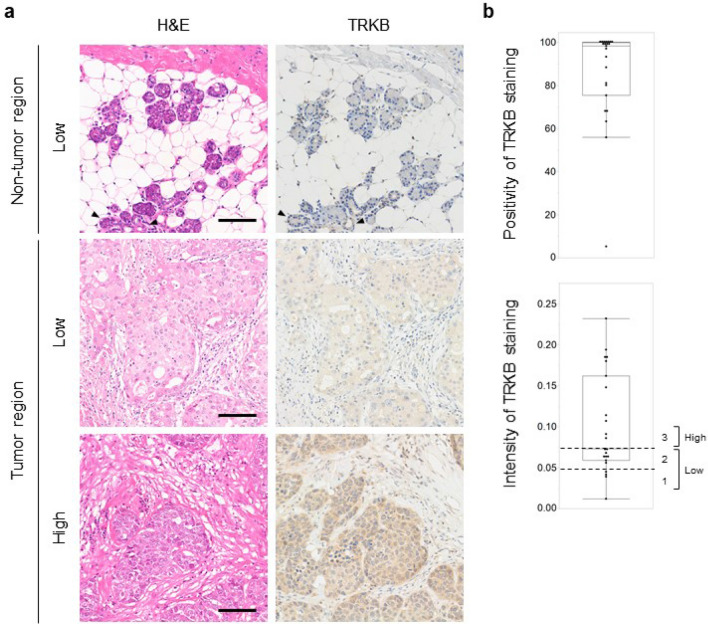
High expression of TRKB in PGCs. (a) Representative H&E and TRKB staining images of tumor tissues from patients with PGC. Arrowheads indicate ductal epithelial cells with faint expression of TRKB. Scale bars, 100 μm. (b) TRKB expression levels in each type of PGC. Positivity and intensity of TRKB staining in cancer cells were analyzed using inForm and Spotfire software. TRKB expression levels were classified into three levels (staining intensity: < 0.05, level 1; 0.05–0.75, level 2; > 0.75, level 3) and divided into two groups: low (levels 1 and 2) and high (level 3).

