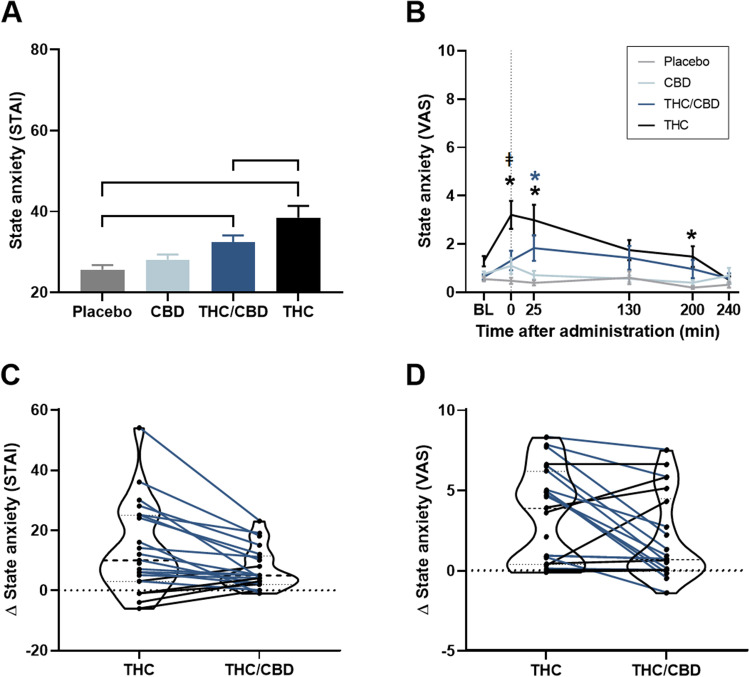
Fig. 1.
Mean (SE) state anxiety (STAI) per treatment (A); mean (SE) state anxiety (VAS) per treatment over time (B); violin plots of drug–placebo differences scores on state anxiety (STAI) (C); and drug–placebo difference peak scores on state anxiety (VAS) (D) with connected individual data points showing less (blue lines) or more (black lines) anxiety after THC/CBD compared to THC. ┌┐ significant treatment contrasts, * significant difference between the treatment condition and placebo and ǂ significant difference between THC and THC/CBD condition (p = 0.02). STAI, State-Trait Anxiety Inventory; VAS, visual analogue scale; BL, baseline

