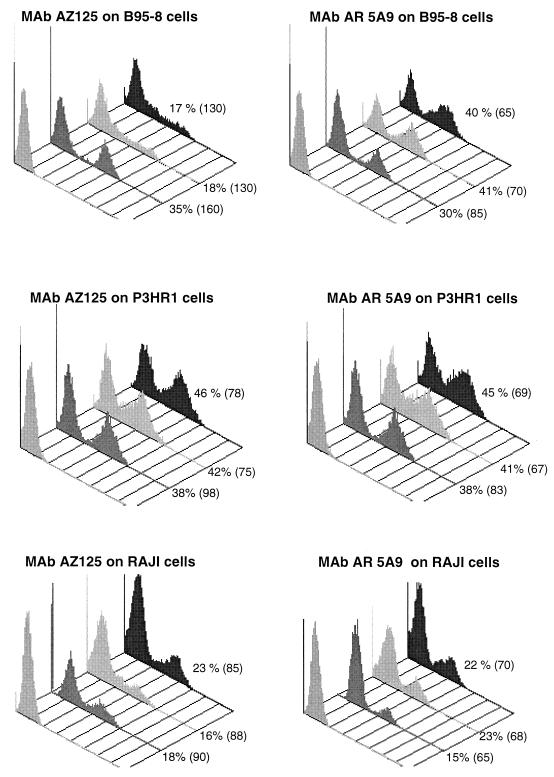
FIG. 1.
Flow cytometry analysis of ZEBRA (MAb AZ125, 1 μg/assay) and Rta (MAb AR5A9, 0.5 μg/assay) antigen expression on three cell lines stimulated by TPA plus n-butyrate and prepared by three different fixation-permeabilization procedures: (left to right) isotype control, PF/M, Intraprep, and Fix&Perm. Percentages are the portions of cells expressing the related antigen. Mean fluorescence intensity is in parentheses.

