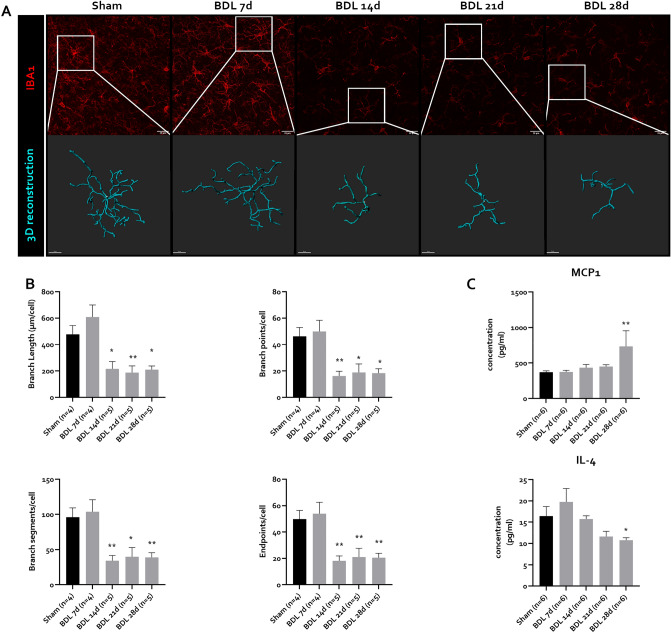
Figure 8.
Microglial activation at different timepoints after BDL in C57Bl/6j mice. (A) Representative confocal maximum intensity projection images of IBA1 positive microglia and magnified 3D reconstructed microglia in prefrontal cortex at different timepoints after BDL. (B) Quantification of 3D reconstructed microglia, showing branch length, number of branch points, branch segments and endpoints per cell in sham (n = 4) or BDL animals (n = 4–5/timepoint) at different timepoints after BDL. (C) Protein levels of MCP-1 and IL-4 in prefrontal cortex in sham (n = 6) or BDL animals (n = 6/timepoint) at different timepoints after BDL. *p < 0.05, **p < 0.01. All data are represented as mean ± SEM. Scale bar IBA1 = 20 µm. Scale bar 3D-reconstruction = 10 µm. BDL bile duct ligation.

