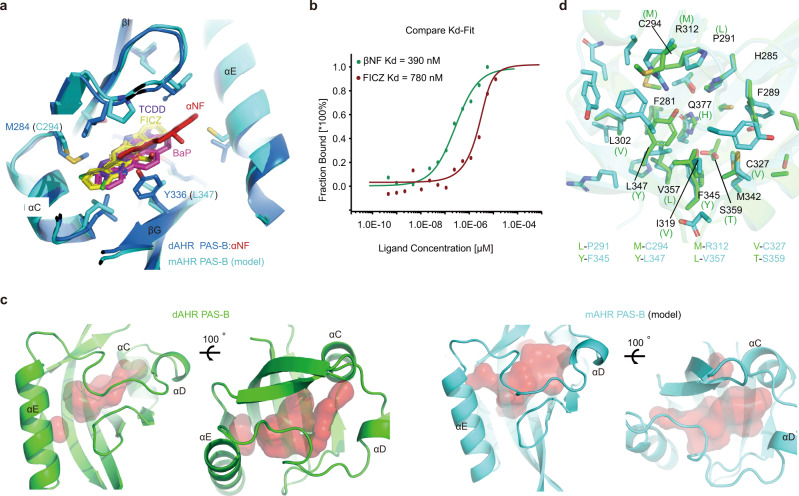
Fig. 3. Comparison of the ligand-binding cavities of dAHR PAS-B and mAHR PAS-B.
a Superposition of the dAHR PAS-B:αNF complex (blue) and mAHR PAS-B:ligand (cyan) docking models. The mAHR PAS-B structure model was created by the program Modeller with the apo dAHR PAS-B structure used as the single template. Ligands are shown in sticks. b Ligand binding property of the dAHR PAS-B M284C/Y336L mutant measured by MST. Data are presented as mean values of two independent experiments. Source data are provided as a Source Data file. c The relative position of the ligand-binding cavity (red surface) of dAHR PAS-B and mAHR PAS-B. Cavity sizes were calculated by the program CASTp using the default probe sphere radius of 1.4 Å. d Cavity comparison of dAHR PAS-B and mAHR PAS-B. Nonconserved residues in the dAHR PAS-B domain are shown in parentheses. A list of mAHR PAS-B residues that evolved from large to small side chains is listed at the bottom.

