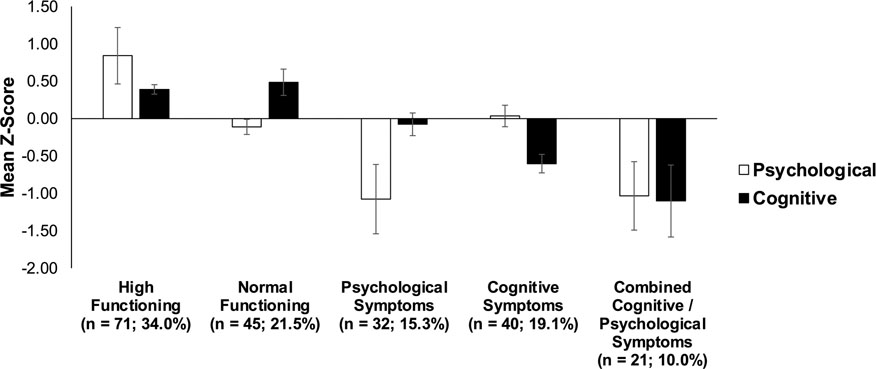
Figure 2. Standardized means collapsed across the psychological and cognitive indicators for each class.
The high functioning (34.0% of the overall sample; n = 71) and normal functioning (21.5%; n = 45) groups performed well across all psychological and cognitive indicators. The cognitive symptoms group (19.1%; n = 40) showed primarily poor cognitive performance but relatively intact psychological functioning, while the psychological symptoms group (15.3%; n = 32) showed worse psychological functioning but intact cognitive performance. The combined cognitive and psychological symptoms group (10.0%; n = 21) demonstrated both worse psychological functioning and cognitive performance.

