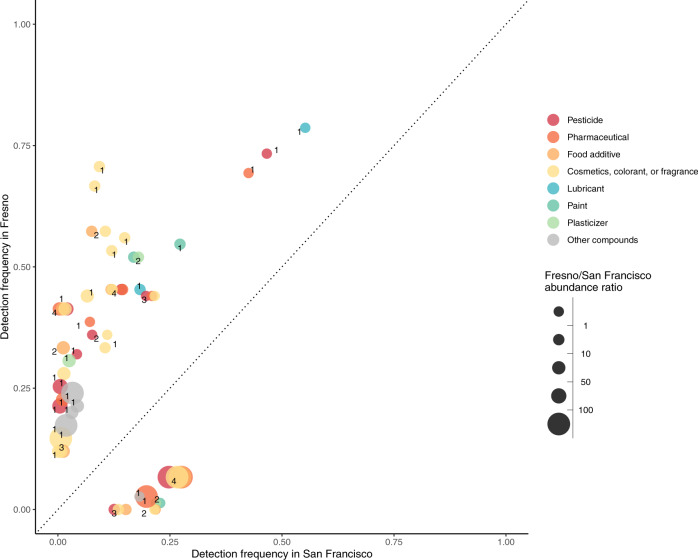
Fig. 4. Differentially detected suspect chemicals, organized by source, in cord serum between Fresno and San Francisco participants.
Note: There were N = 64 participants in Fresno and N = 64 participants in San Francisco in this analysis. Any chemicals that were identified as potentially endogenous were removed from this plot. Individual chemicals may appear multiple times in multiple categories if they were present in databases for multiple categories. When this occurs the points are slightly jittered to show each of the categories. The number next to the chemicals indicate how many categories one chemical falls under, and therefore how many markers belong to each chemical. The size of each marker reflects the ratio of the average abundances across participants for each suspect chemical in Fresno compared to San Francisco. The median ratio of average abundances in Fresno compared to San Francisco was 3.0. All differentially detected chemicals had detection frequencies that were significantly different between cities at the 0.05 level.

