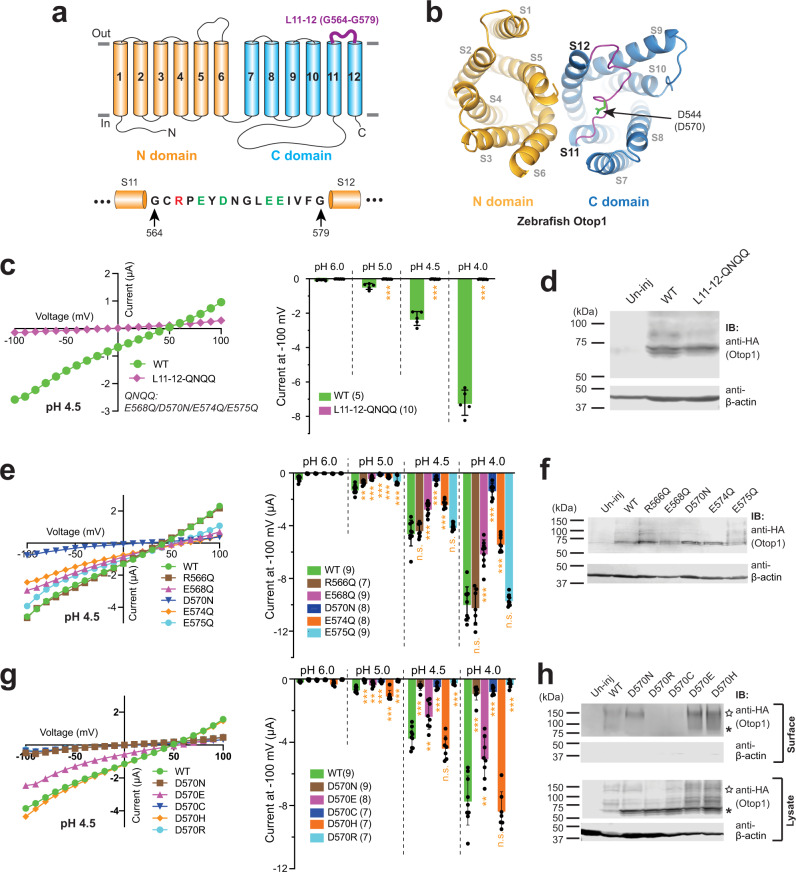
Fig. 5. D570 in L11–12 is critical for the function of the Otop1 channel.
a Schematic illustration shows the locations of the L11–12 in the topology structure of Otop1. The amino acid sequence of the loop is presented at the bottom and the negatively and positively charged residues are in green and red, respectively. b The cryo-EM structure of the zebrafish Otop1 (PDB 6NF4)23. The S11–S12 loop, which is in purple, is shown from the top views. The side chain of D544 (corresponding to D570 in human Otop1) is shown as green sticks. c, e, and g Left: the representative I–V curves of the indicated WT and mutant Otop1 channels. Right: the scatter plot and bar graph showing the currents of the indicated channels recorded at −100 mV at the indicated pHs. Data in the bar graphs are presented as mean ± SD. Currents of the mutants were compared to that of the WT with Student’s t-test (*P < 0.05, ***P < 0.001, n.s.: no significance). Oocyte numbers for scatter plots and bar graphs are indicated in parentheses. Currents in bar graphs are normalized to the mean of the WT currents at pH 4 recorded from the same batch of oocytes. d, f Western blot showing the expression of indicated WT and mutants. h Western blot showing the overall expression (in lysate samples) and surface expression of indicated WT and mutant channels. The surface proteins were purified by surface biotinylation. The asterisks and stars indicate the monomer and dimer bands of Otop1, respectively.

