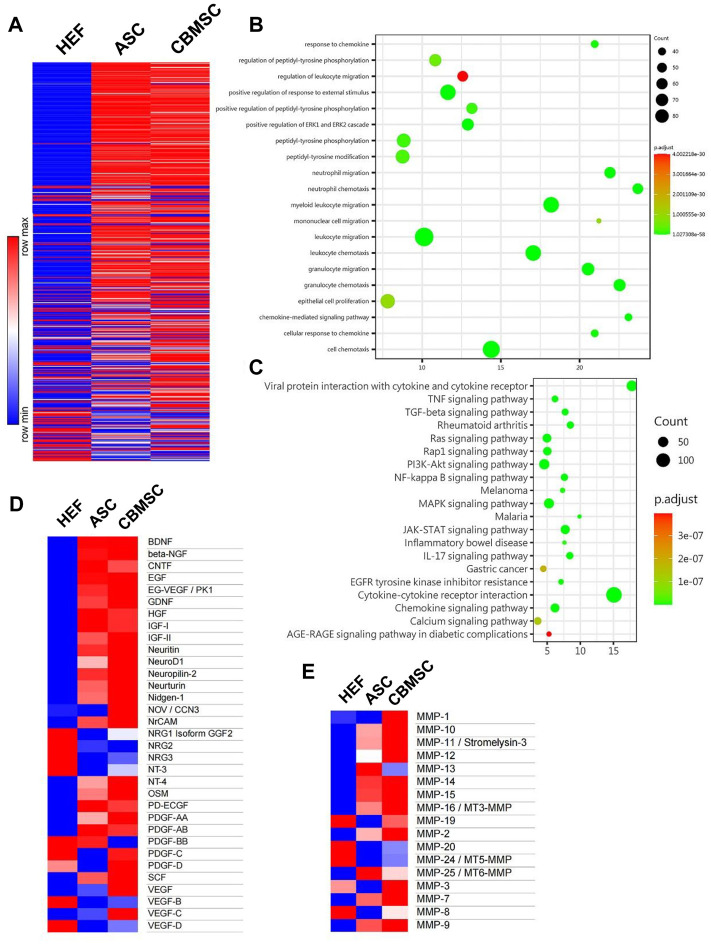
FIGURE 6.
Soluble factors secreted by CBMSCs and ASCs in the conditioned medium were analyzed using protein chips. (A) Relative concentration of 507 proteins in HEF-CM, ASC-CM, and CBMSC-CM is shown in a heat map. (B) Gene Ontology (GO) function enrichment analysis of biological processes of CBMSC-CM vs. ASC-CM. (C) KEGG signaling pathway enrichment analysis of CBMSC-CM vs. ASC-CM. Heat map of differentially expressed neurotrophic factors (D) and matrix metalloproteinases (E) in CBMSC-CM vs. ASC-CM. See also Supplementary Tables S1–S3. hEF, CBMSC, and ASC represent the CMs of these cells.

