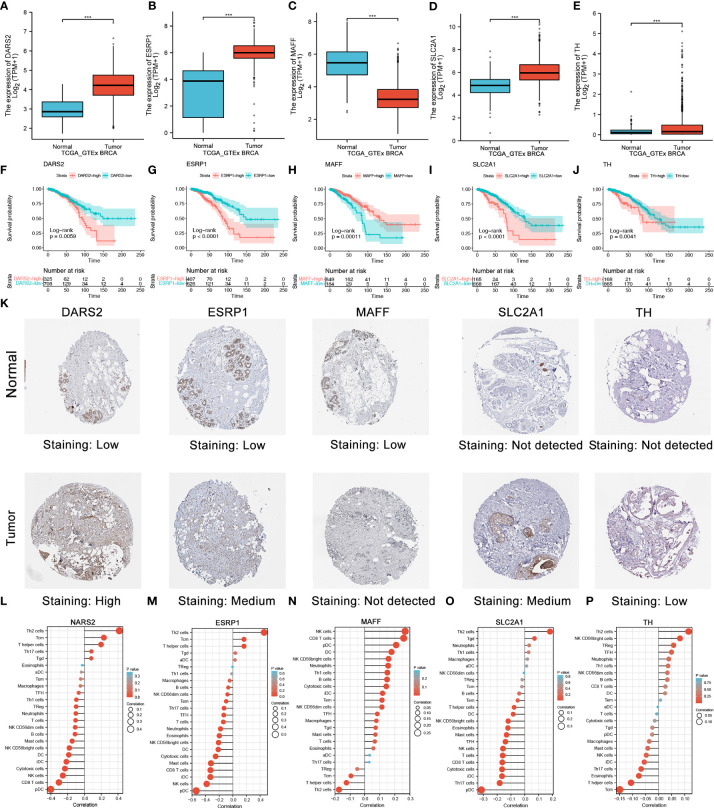
Figure 10.
Validation of five selected HLMRGs. (A–E) Comparisons of the five HLMRGs between the BC and normal tissues combined with GTEx data. (F–J) Survival curve analysis of five HLMRGs based on TCGA. (K) Immunohistochemical staining for five HLMRGs in the normal breast tissue and BC. (L–P) Relationship between NARS2, ESRP1, MAFF, SLC2A1, and TH levels and immune cell infiltration based on ssGSEA. Statistical significance at the level of ***≤0.001.

