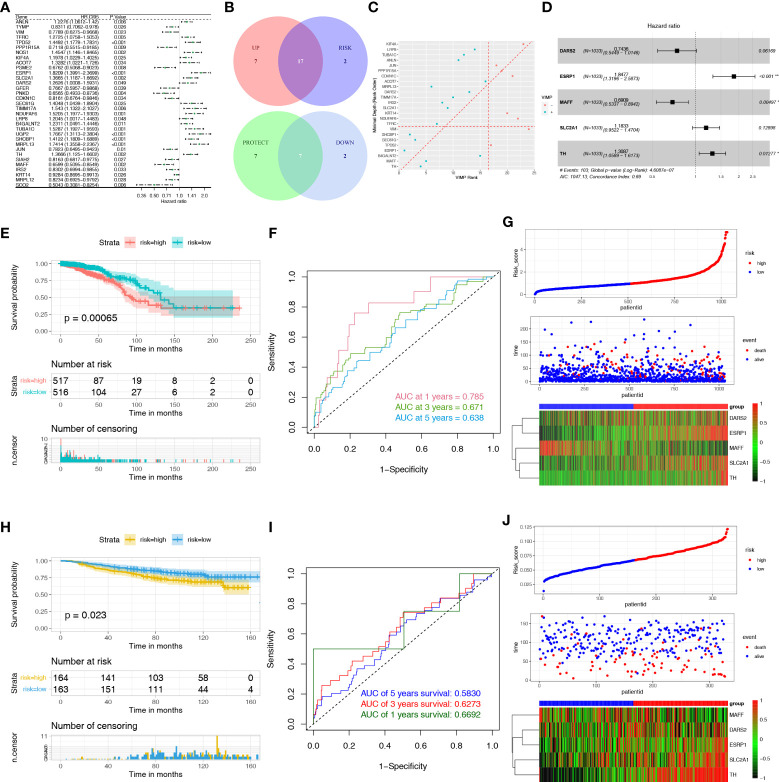
Figure 3.
Construction and evaluation of the HLMRPM. (A) Univariate Cox regression analysis of the DEHRGs and DELMRGs in the training cohort. (B) The veen diagram indicated the favorable and unfavorable genes. (C) The genes were ranked by the minimal depth and VIMP. (D) The forest graph showed the results of stepwise multivariable cox proportional hazards regression analysis. (E) The OS curve of the two risk groups in TCGA cohort. (F) The time-dependent ROC curves of the HLMRPM in TCGA cohort. (G) The risk score, clinical event, and the model genes between the two risk groups in TCGA cohort. (H) The OS curve of the two risk groups in GSE20685 cohort. (I) The time-dependent ROC curves of the HLMRPM in GSE20685 cohort. (J) The risk score, clinical event, and the model genes between the two risk groups in GSE20685 cohort.

