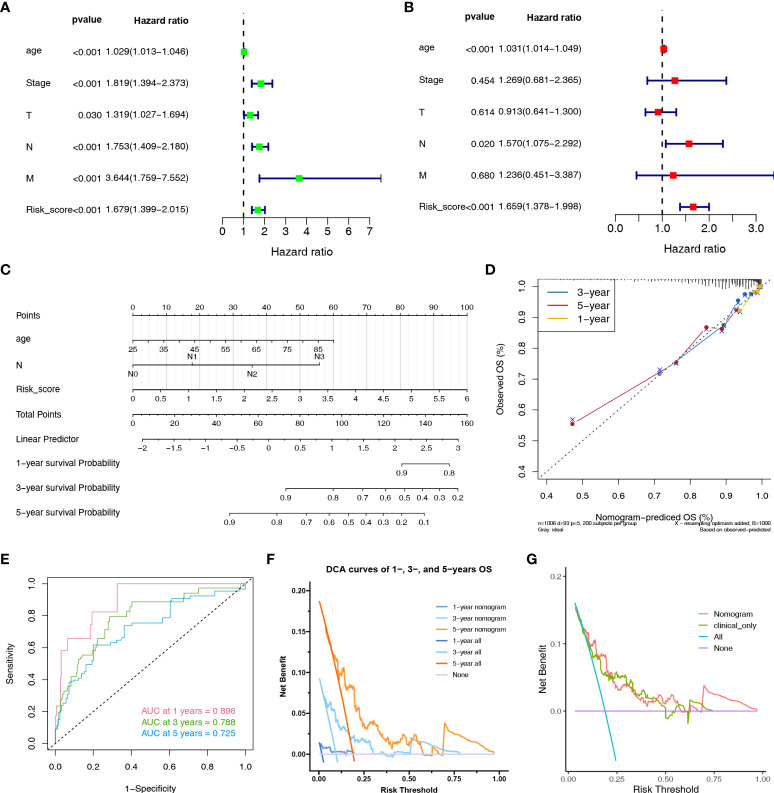
Figure 5.
Nomogram to evaluate the OS probability of BC patients. The univariate (A) and multivariate (B) Cox regression analyses in TCGA cohort. (C) The nomogram for predicting the 1-, 3- and 5-year OS probabilities. (D) Calibration curves of the nomogram to predict 1-, 3- and 5-year OS probabilities. (E) ROC curves of the nomogram. (F) DCA curves of the nomogram at 1-, 3- and 5-year indicated its net clinical benefits. (G) DCA curves of the nomogram and only clinical characteristics (combination of age and N stage).

