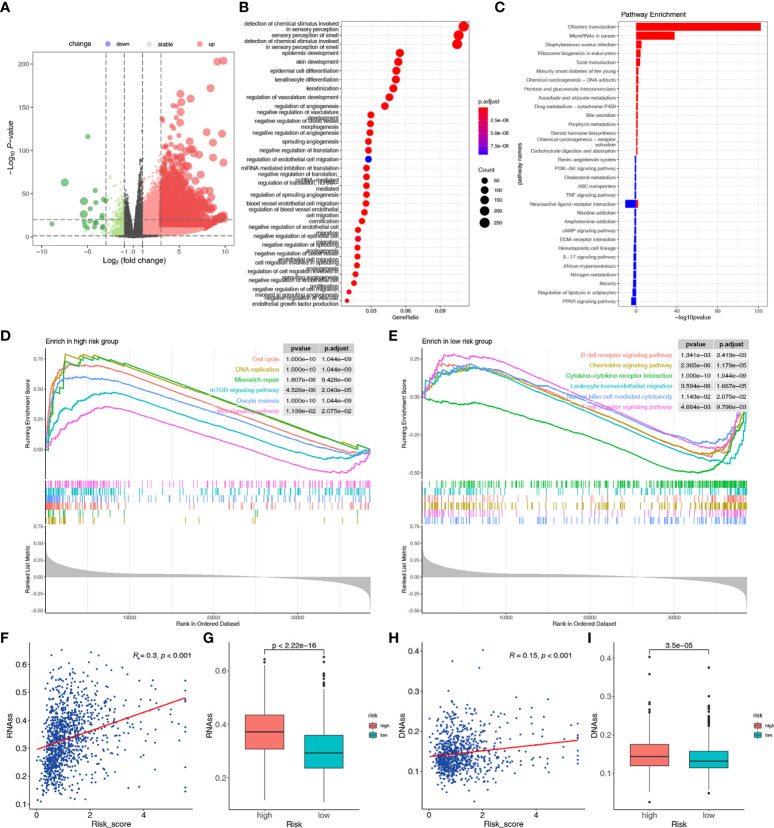
Figure 6.
Functional enrichment, stemness, and m6A modification-related analyses between the two risk groups. (A) The volcano plot of the DEGs between the high-risk and low-risk groups. (B) The GO analysis of the DEGs. (C) The KEGG analysis of the DEGs. The pathways enriched in the high-risk (D) and low-risk (E) groups according to the GSEA. (F) The relationship between risk score and RNAss. (G) Differences in RNAss between the two risk groups. (H) The relationship between risk score and DNAss. (I) Differences in DNAss between the two risk groups.

