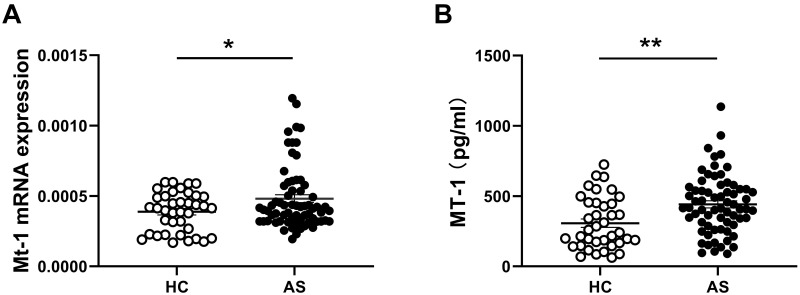
Figure 1.
Comparison of MT1 mRNAs and protein levels between AS and HC. (A) Expressions of MT1 in PBMCs from AS patients (n = 67) and healthy controls (HC, n=38) were measured by RT-PCR, results are showed as mean± SEM. (B) Serum MT1 protein levels in AS patients (n= 67) and HC (n= 38) were measured by ELISA. Each symbol represents an individual patient and HC. Horizontal lines indicate median values. Differences between two groups were performed with unpaired Student’s t-test. *P<0.05; **P<0.01.

