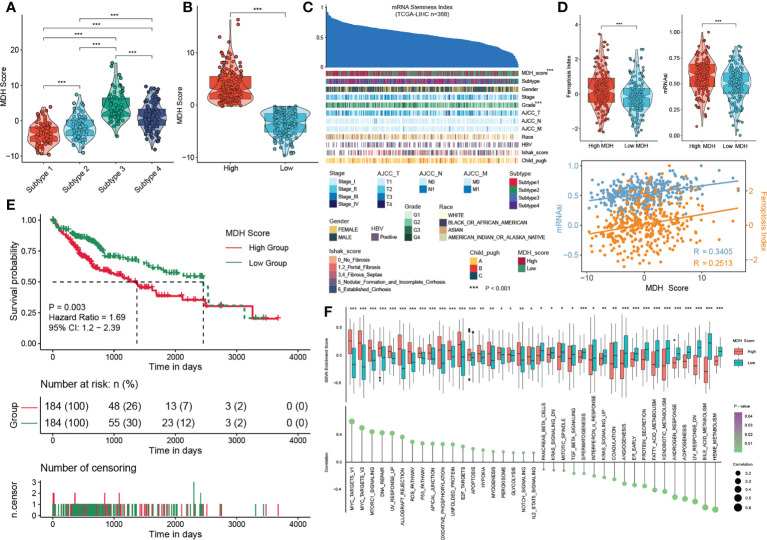
Figure 5.
Construction of the MDH score. (A) MDH score of distinct MDH subtypes in the TCGA-LIHC cohort. (B) The TCGA-LIHC cohort was divided into two groups based on median expression values of MDH scores. (C) An overview of the association between known clinical features and mRNAsi in patients in the TCGA-LIHC cohort. Columns represent samples sorted by mRNAsi from low to high (top row). Rows represent known clinical and molecular features. (D) mRNAsi score and ferroptosis index in the MDH high- or low-score groups of the TCGA-LIHC cohort. Correlation analysis of mRNAsi scores, ferroptosis index and MDH score in patients in the TCGA-LIHC cohort. (E) Survival analyses for MDH high- or low-score groups of the TCGA-LIHC cohort. (F) GSVA enrichment analysis showing the activation states of biological pathways in the MDH high- or low-score groups. The upper and lower ends of the boxes represent the interquartile range of values. The lines in the boxes represent the median value, and black dots show outliers. The asterisks in A, B, D and F represent the statistical p-value (*P< 0.05; **P< 0.01 and ***P< 0.001).

