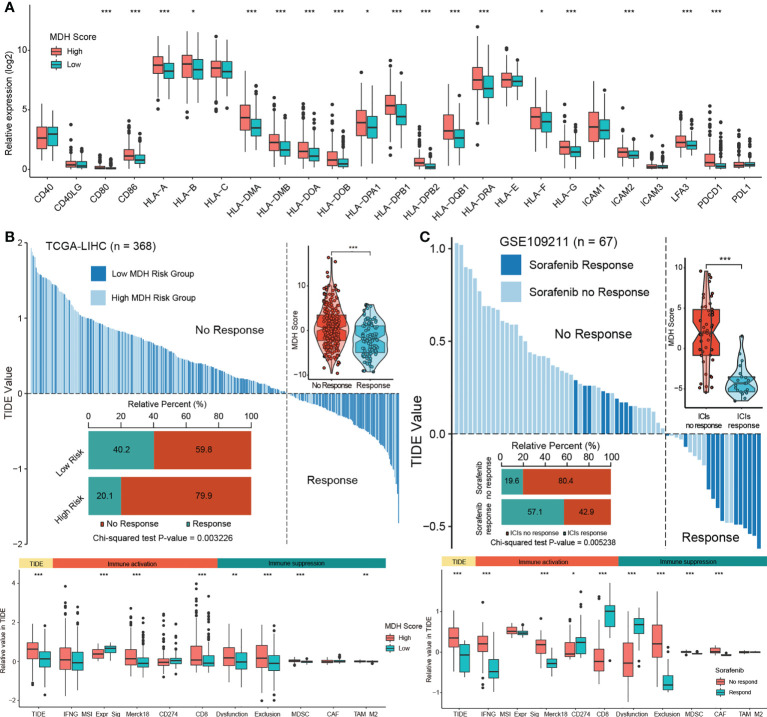
Figure 6.
The MDH score predicts the immunotherapy response in HCC. (A) Differences in the expression of MHC molecules, costimulatory molecules and adhesion molecules in the MDH high- or low-score groups of the TCGA-LIHC cohort. The upper and lower ends of the boxes represent the interquartile range of values. The lines in the boxes represent the median value, and black dots show outliers. (B) TIDE value of MDH high- or low-score groups of TCGA-LIHC cohort. (C) TIDE values of sorafenib responders and nonresponders in the GSE109211 cohort. The chi-square test was used to calculate significant differences in (B, C) The asterisks represent the statistical p-value (*P< 0.05; **P< 0.01 and ***P< 0.001).

