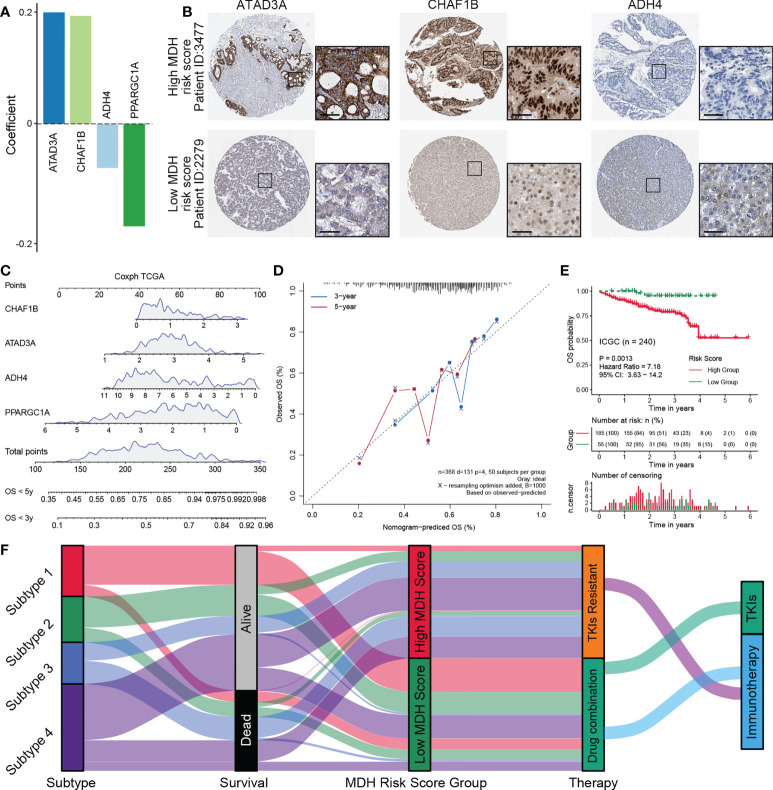
Figure 8.
Construction of a nomogram predicting OS outcomes based on the MDH risk score in the TCGA-LIHC cohort. (A) Coefficients of 4 genes involved in the prognostic signatures. (B) Representative IHC images of ATAD3A, CHAF1B and ADH4 in MDH high- or low-score groups from the Human Protein Atlas. Scale bar denotes 50 μm. (C) Nomogram to predict the 3‐y and 5‐y overall survival of HCC patients. (D) Calibration curve for the comprehensive survival nomogram model in the TCGA-LIHC cohort. The dashed diagonal line represents the ideal situation, and the blue and red lines represent the 3‐y and 5‐y observed nomograms, respectively. (E) Survival analysis for the MDH risk score in the ICGC cohort. (F) Alluvial diagram showing the association of the MDH subtype with patient survival status, MDH score and individualized therapy.

