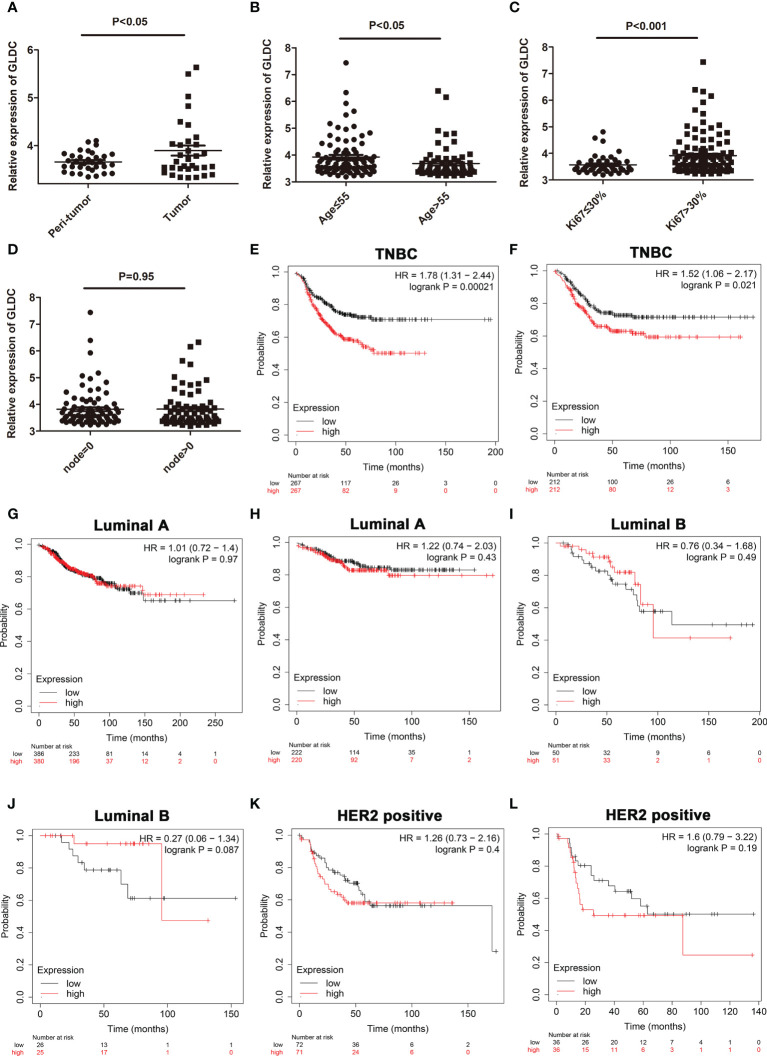
Figure 2.
The expression profiles of GLDC and its prognoses value in TNBC tissues. (A) The expression of GLDC was significantly higher in the TNBC tissues compared with their adjacent normal tissues (n=33). (B) The expression of GLDC is higher in the patients younger than 55 years (age ≤ 55) than the patients older than 55 years (age>55). (C) GLDC expression in the patients with ki67 ≤ 30% was less than that with ki67>30%. (D) No significant differences were detected on the expression of GLDC between positive lymph nodes and no positive lymph nodes. (E, F) TNBC patients with high levels of GLDC were associated with the shorter RFS (E) and the worse DMFS (F). (G, H) There were no significant differences on the RFS (G) and DMFS (H) between the low levels of GLDC and the high levels of GLDC in Luminal A breast cancer. (I, J) No significant differences were detected on the RFS (I) and DMFS (J) between the two groups in Luminal B breast cancer. (K, L) There were no significant differences on the RFS (K) and DMFS (L) between the two groups in HER2 positive breast cancer.

