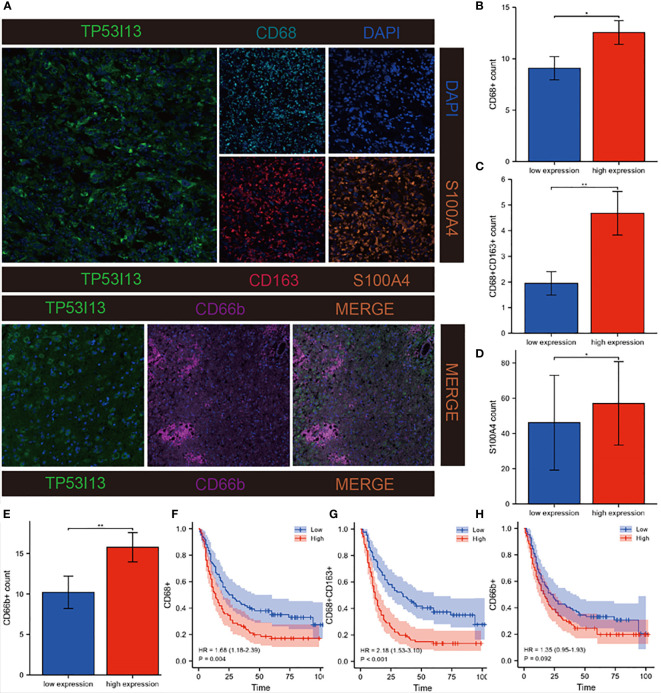
Figure 10.
Investigation of correlations between TP53I13 and macrophages, neutrophils, and CAFs markers on samples from Nantong University Affiliated Hospital. (A) mIHC of TP53I13 and different macrophage markers (CD68, CD163), neutrophils marker (CD66b), and CAFs marker (S100A4). (B-E) The relationships between the TP53I13 expression and CD68+, CD68+CD163+, S100A4, and CD66b+. (F-H) Survival analysis of TP53I13 high- and low-expression and CD68+, CD68+CD163+, and CD66b+. *P < 0.05, **P < 0.01.

