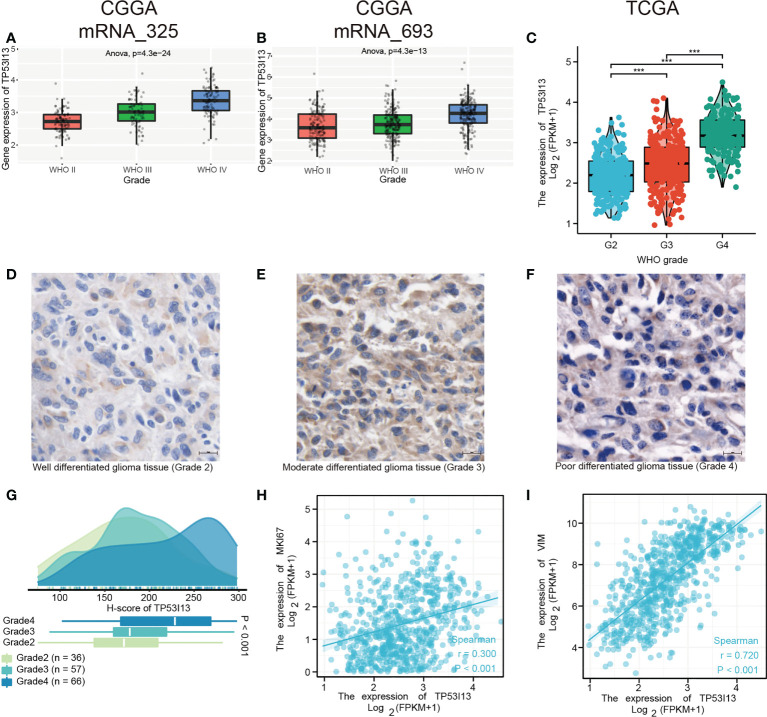
Figure 4.
TP53I13 Expression in subgroups of glioma patients based on IDH mutation status, WHO grade, and 1p/19q codeletion status. Boxplot shows a correlation between TP53I13 expression and WHO grade based on (A) the CGGA mRNAseq_325 dataset, (B) the CGGA mRNAseq_693 dataset, and (C) the TCGA database. (D-F) IHC of TP53I13 in glioma tissues of different WHO grades. (G) Quantification of TP53I13 staining in glioma tissues of different WHO grades. (H) The relationship between TP53I13 and a proliferation marker (Ki-67). (I) The relationship between TP53I13 and invasion markers (vimentin).

