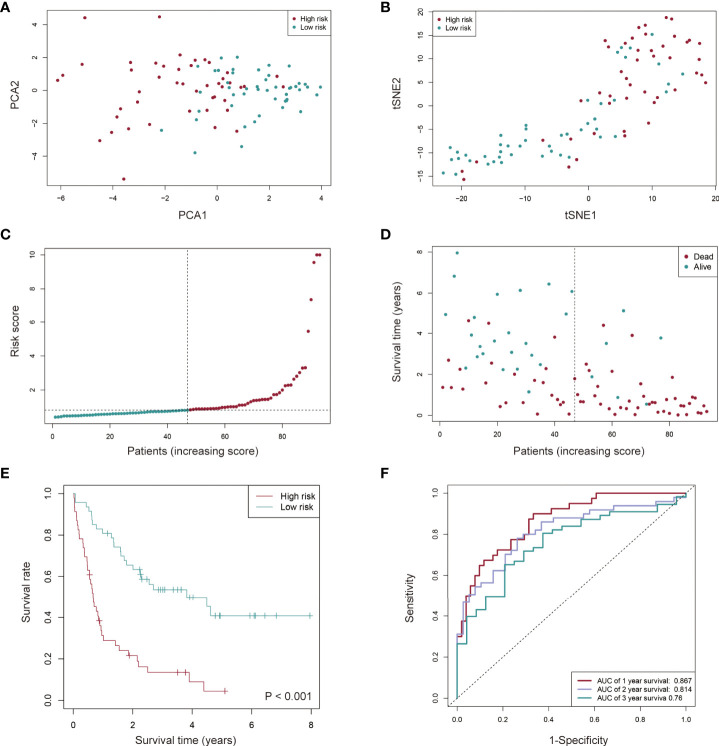
Figure 4.
Prognostic value of the cuproptosis-related lncRNA signature in AML patients from the TCGA cohort. (A, B) AML patients in distinct risk groups could be separated into two clusters based on the PCA (Principal component analysis) (A) and t-distributed stochastic neighbor embedding (t-SNE) method (B). (C, D) Distribution of the risk score (C) and survival time of each patient (D). (E) Kaplan-Meier survival analysis of overall survival (OS) for AML patients with low- and high-risk groups. (F) The sensitivity and specificity of the prognostic model for AML patients assessed using the 1-, 2-, and 3-year ROC (receiver operating characteristic) curves and AUC (area under curve).

