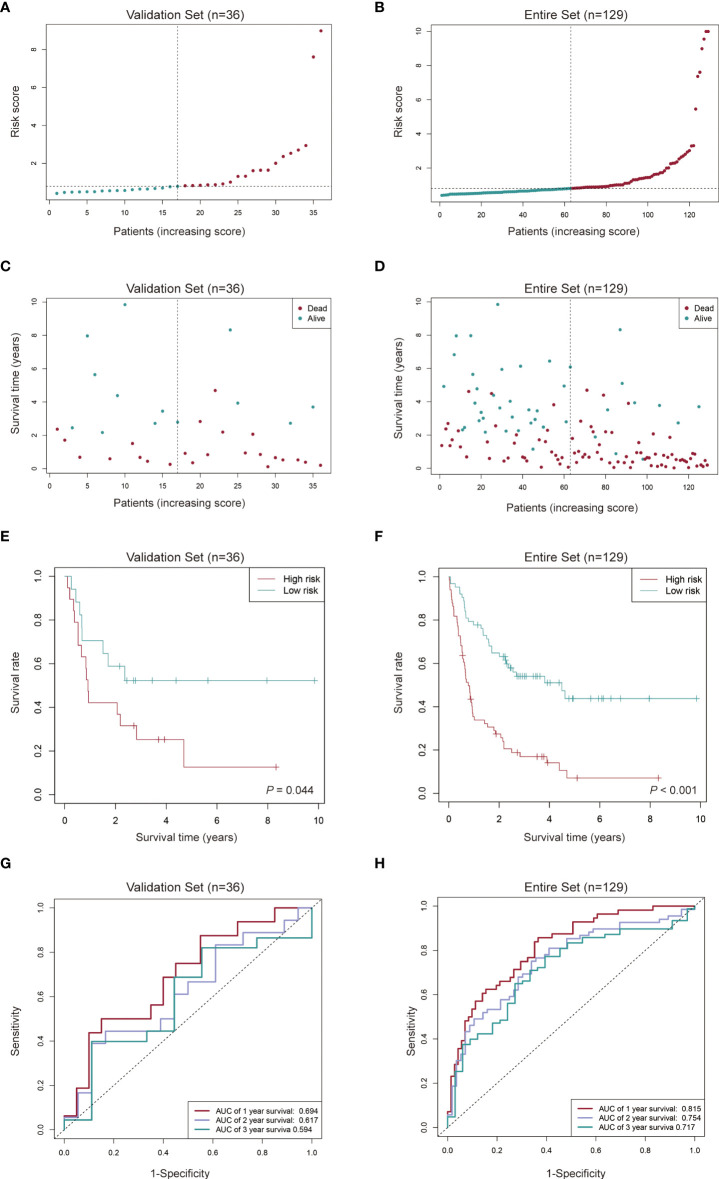
Figure 5.
Evaluation of the cuproptosis-related lncRNA signature in the validation set and the entire set. (A-D) Distribution of the risk score and survival time of each patient in the validation set (A, C) and entire set (B, D). (E, F) Kaplan-Meier curve analysis of the signature in the validation set (E) and entire set (F). (G, H) ROC curves and their AUC values showed 1-, 2-, and 3-year predictions in the validation set (G) and entire set (H).

