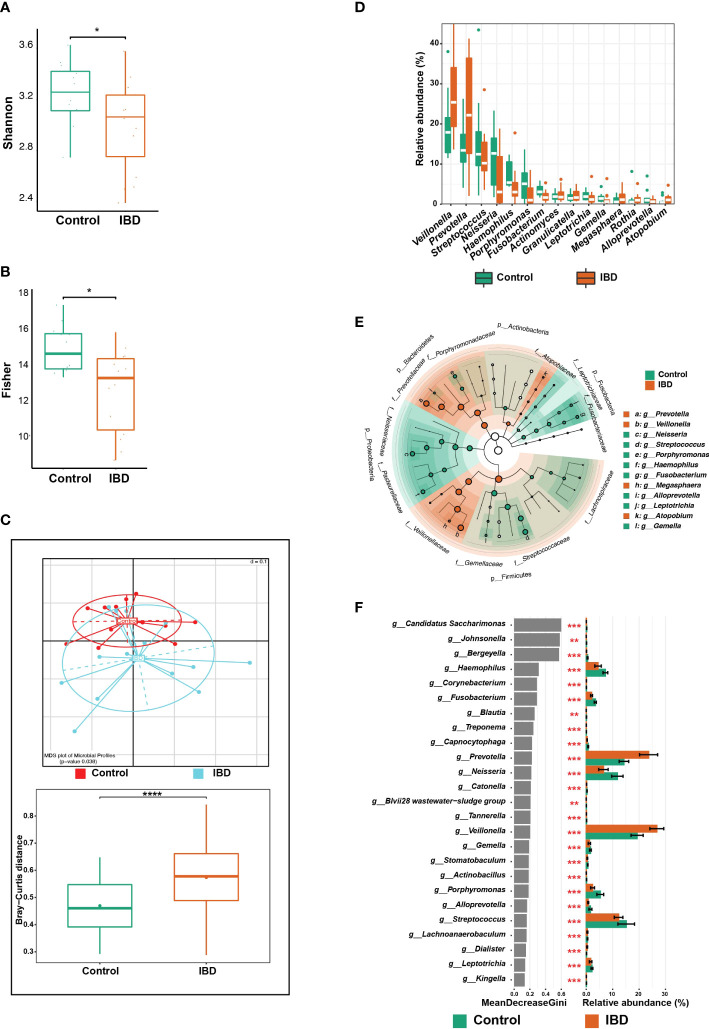
Figure 1.
Changes in the salivary microbiome of IBD patients compared to healthy controls. (A) Boxplots show alpha diversity analysis performed on 15 saliva samples from 14 IBD patients (including one additional sample from P01) and 12 from 12 control subjects. (B) Boxplots showing the significance of Fisher’s test comparing the alpha diversity of the two groups without the additional sample from P01. (C) Beta diversity analysis represented by multidimensional scaling (MDS) and pairwise Bray-Curtis distances (boxplots). (D) Boxplots showing differentially abundant genera. (E) LEfSe cladogram demonstrating the phylogenetic relationship among genera that were enriched in both groups, where the dot size represents the mean abundance of the genus. (F) The top 25 significant genera were identified using random forest models, ranked by the index of accuracy and Gini. The symbols (*), (**), (***), and (****) indicate the significance values of P < 0.05, P < 0.01, P < 0.001, and P < 0.0001, respectively.

