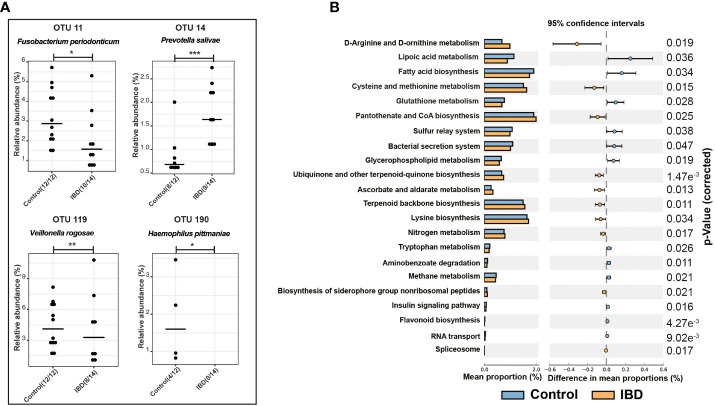
Figure 2.
Differential OTUs abundances and metabolic functions of the salivary microbiome. (A) Significantly abundant OTUs that were increased in the salivary microbiome of IBD patients and healthy controls and their representative species according to BLAST analysis. (B) PICRUSt analysis showing KEGG pathways significantly enriched in the salivary microbiome of IBD and healthy controls. The symbols (*), (**), and (***) indicate the significance values of P < 0.05, P < 0.01, and P < 0.001, respectively.

