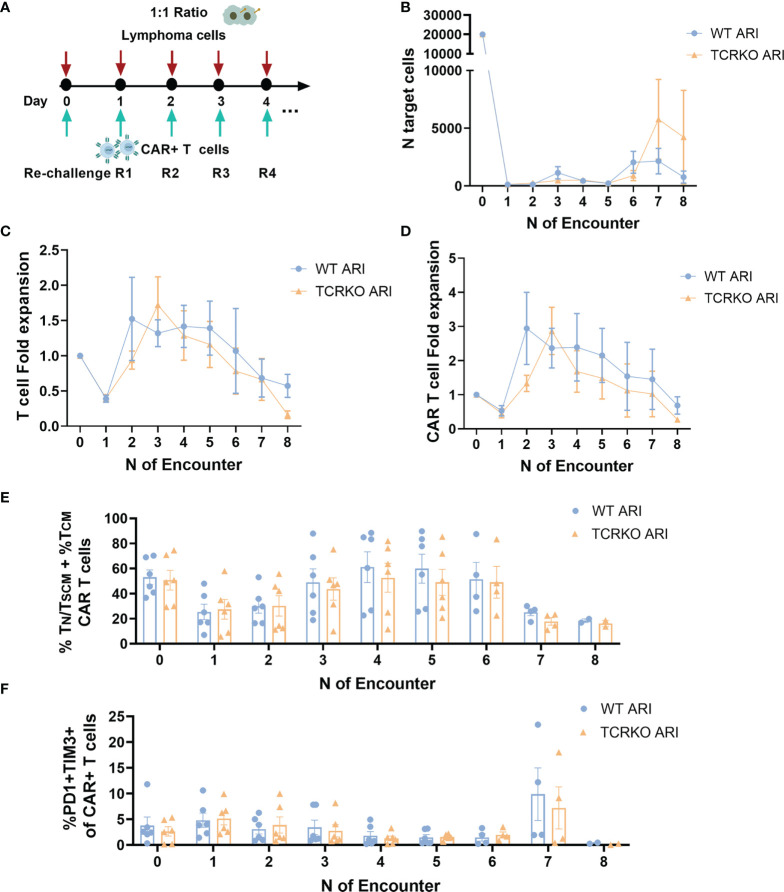
Figure 5.
TCRKO CAR T cells maintain effector potency after highly repetitive tumor re-challenge. (A) Schema of second tumor re-challenge assay. CAR-T cells were co-cultured with Namalwa cells (E:T = 1:1) and rechallenged every day. (B) Graph showing number of remaining tumor cells quantified by flow cytometry every 24h. (C, D) Graph showing T cell (C) or CAR-T cells (D) fold expansion after every encounter relativized to the initial numbers of seeded cells. (E) Percentage of TN/TSCM +TCM of WT ARI-0001 and TCRKO ARI-0001 after the different re-challenges with Namalwa cells. (F) Graph showing the percentage of PD1+TIM3+ cells in WT ARI-0001 and TCRKO ARI-0001 after the different re-challenges with Namalwa cells. Graphs show mean ± SEM of n=6 independent donors/group.

