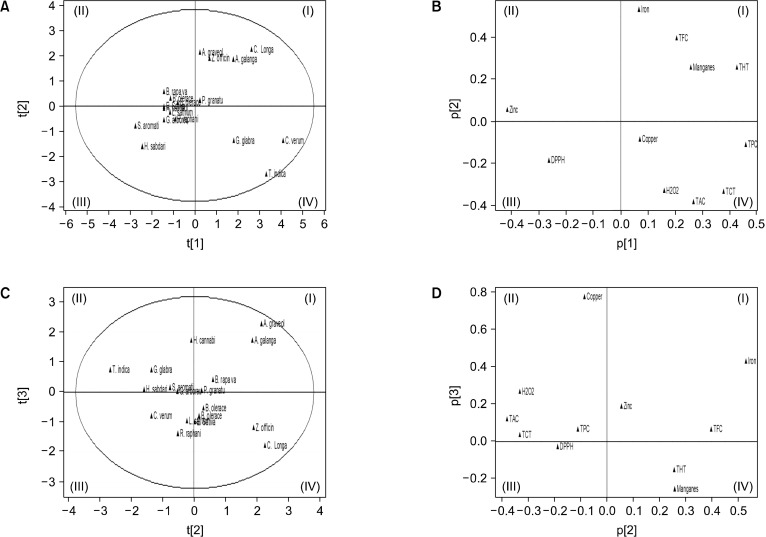
Fig. 1.
Scores and Loadings plot of principle components analysis. (A, C) Scores plot for the 18 examined plant extracts. (B, D) Loadings plot for results of 9 different variables. The t[1], t[2], and t[3] indicate matrix of scores that summarizes X variables. The p[1], p[2], and p[3] indicate matrix of loading showing the influence of variables. TPC, total phenol contents; TFC, total flavonoid contents; TAC, total anthocyanin contents; THT, total hydrolyzed tannin; TCT, total condensed tannin; DPPH, 1,1-diphenyl-2-picryl-hydrazyl-scavenging activity; H2O2, pro-oxidant activity; different metal ions contents (copper, manganese, iron, and zinc). PC1, first principal components; PC2, second principal components; PC3, third principal components.

