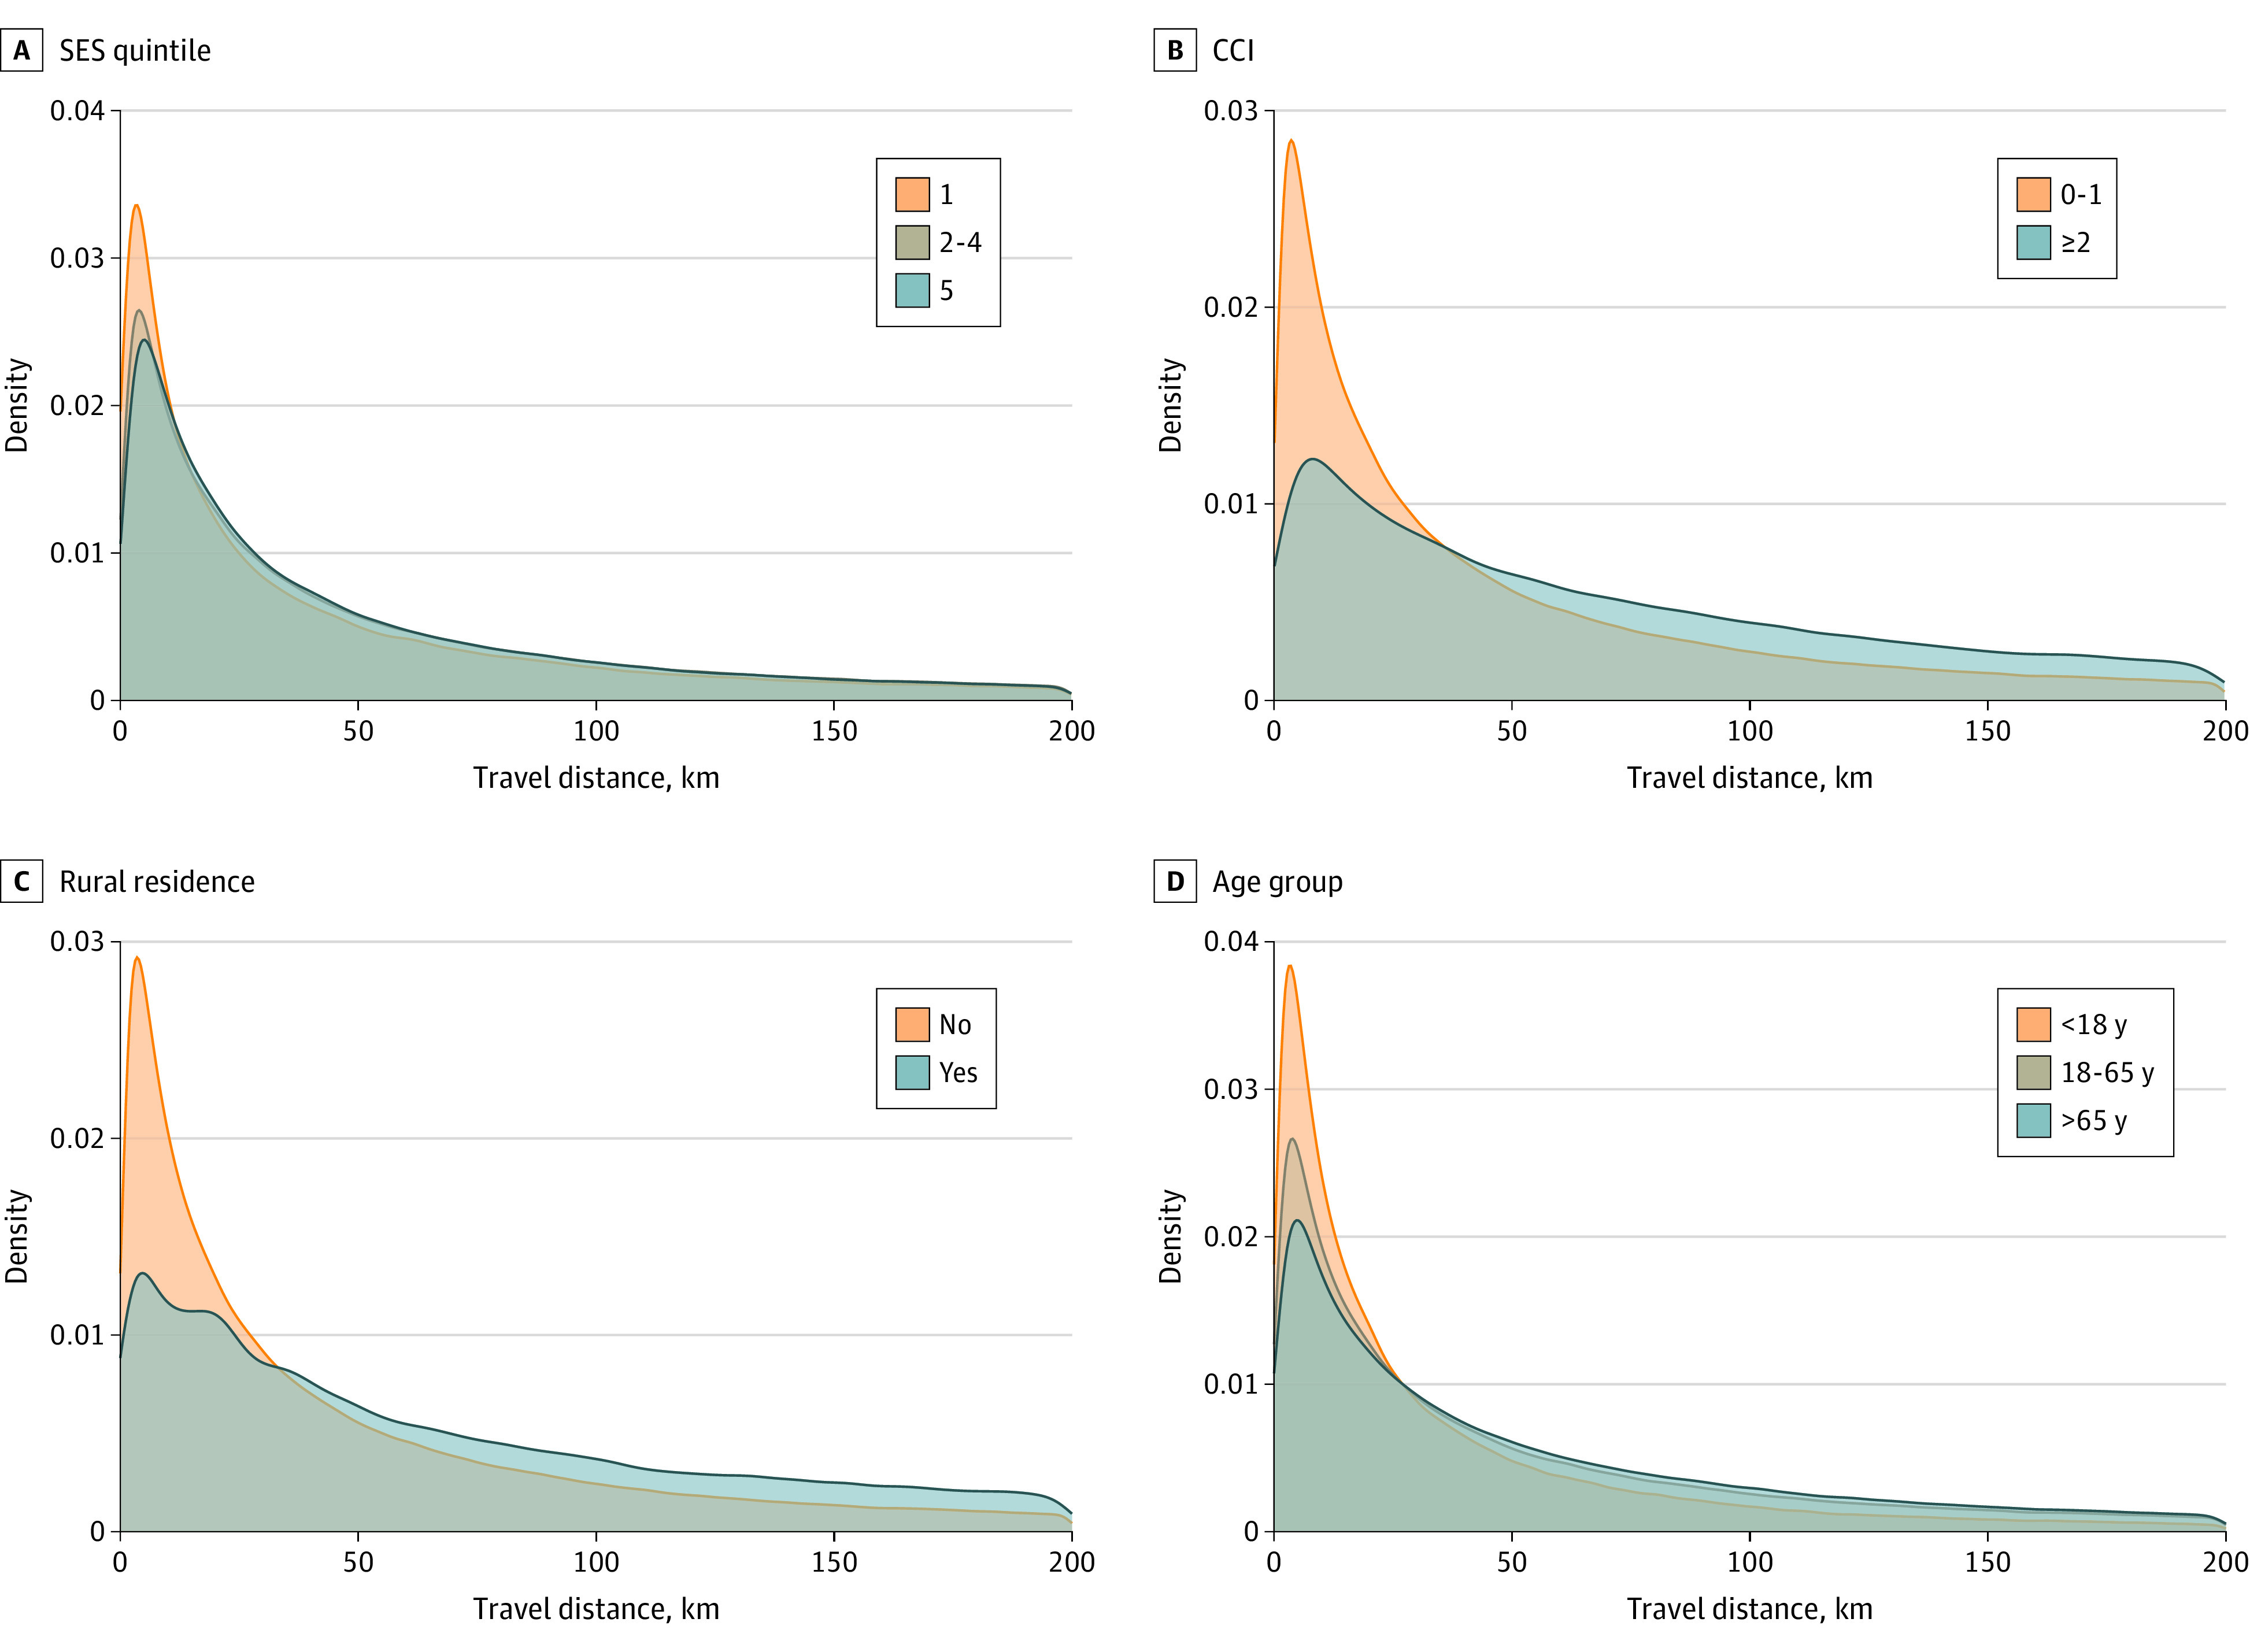
Figure 4. Density Plots of the Total Kilometers of Travel Distance Avoided per Patient Stratified by Socioeconomic Status (SES) Quintile, Charlson Comorbidity Index (CCI) Score, Rural Residence, and Age.

SES quintile 1 indicates lowest SES and quintile 5 indicates highest SES. CCI score of less than 2 indicates low comorbidity; greater than or equal to 2 indicates high comorbidity.
