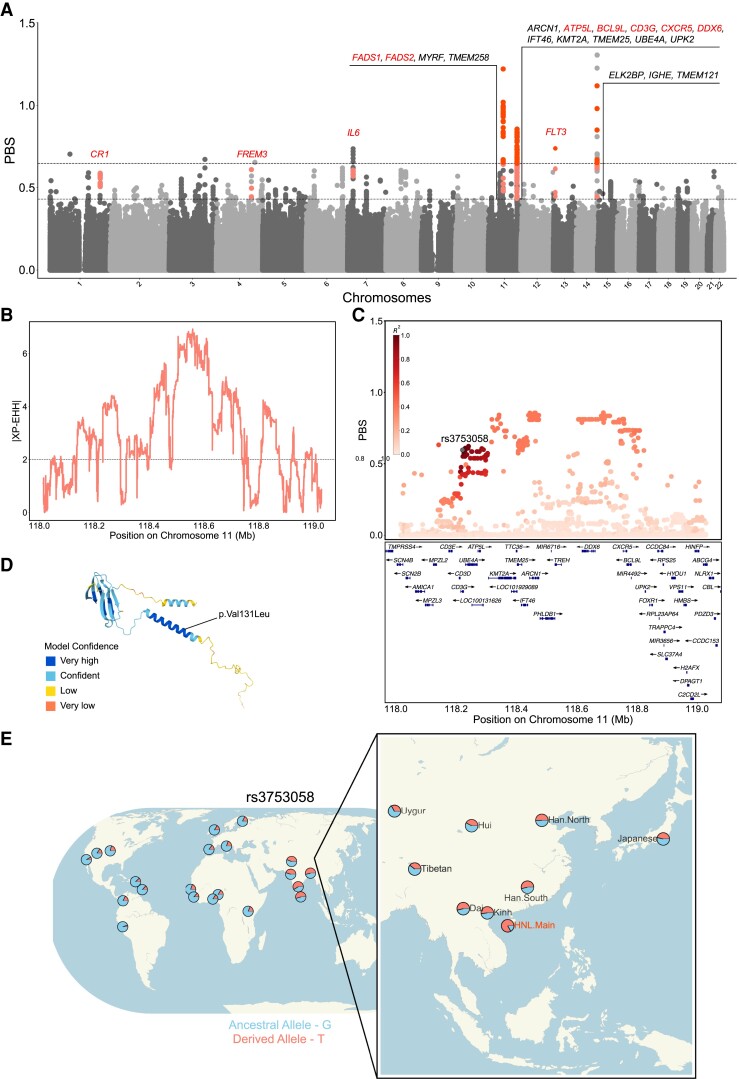
Fig. 4.
Local adaptation identified in HNL. (A) Manhattan plot showing the PBS values in genome-wide scan for HNL.Main, using the Han and CEU as reference populations. The 99.995th and 99.999th percentiles of the PBS distribution are shown as dashed horizontal lines. Gene symbols with PBS values over the 99.999th percentile and with PBS over the 99.995th percentile but showing putative functions are labeled. Gene symbols with putative functions are highlighted with color. Corresponding variants over the 99.999th and 99.995th percentiles are colored as dark and light dots, respectively. (B) Example of a genomic region located in chromosome 11 under positive selection identified by the XP-EHH method. (C) Local PBS distributions of example putative functional adaptive variant rs3753058 within CD3G. The concerning adaptive variant (rs3753058) is labeled, whereas other SNVs are colored according to pairwise linkage disequilibrium with this variant based on the HNL-Han-CEU trio data set. (D) The protein tertiary structure predicted by AlphaFold shows the functional consequences of the loss-of-function variant rs3753058 within CD3G. (E) Population prevalence for the DAF of the rs3753058 based on the PGG.SNV database.

